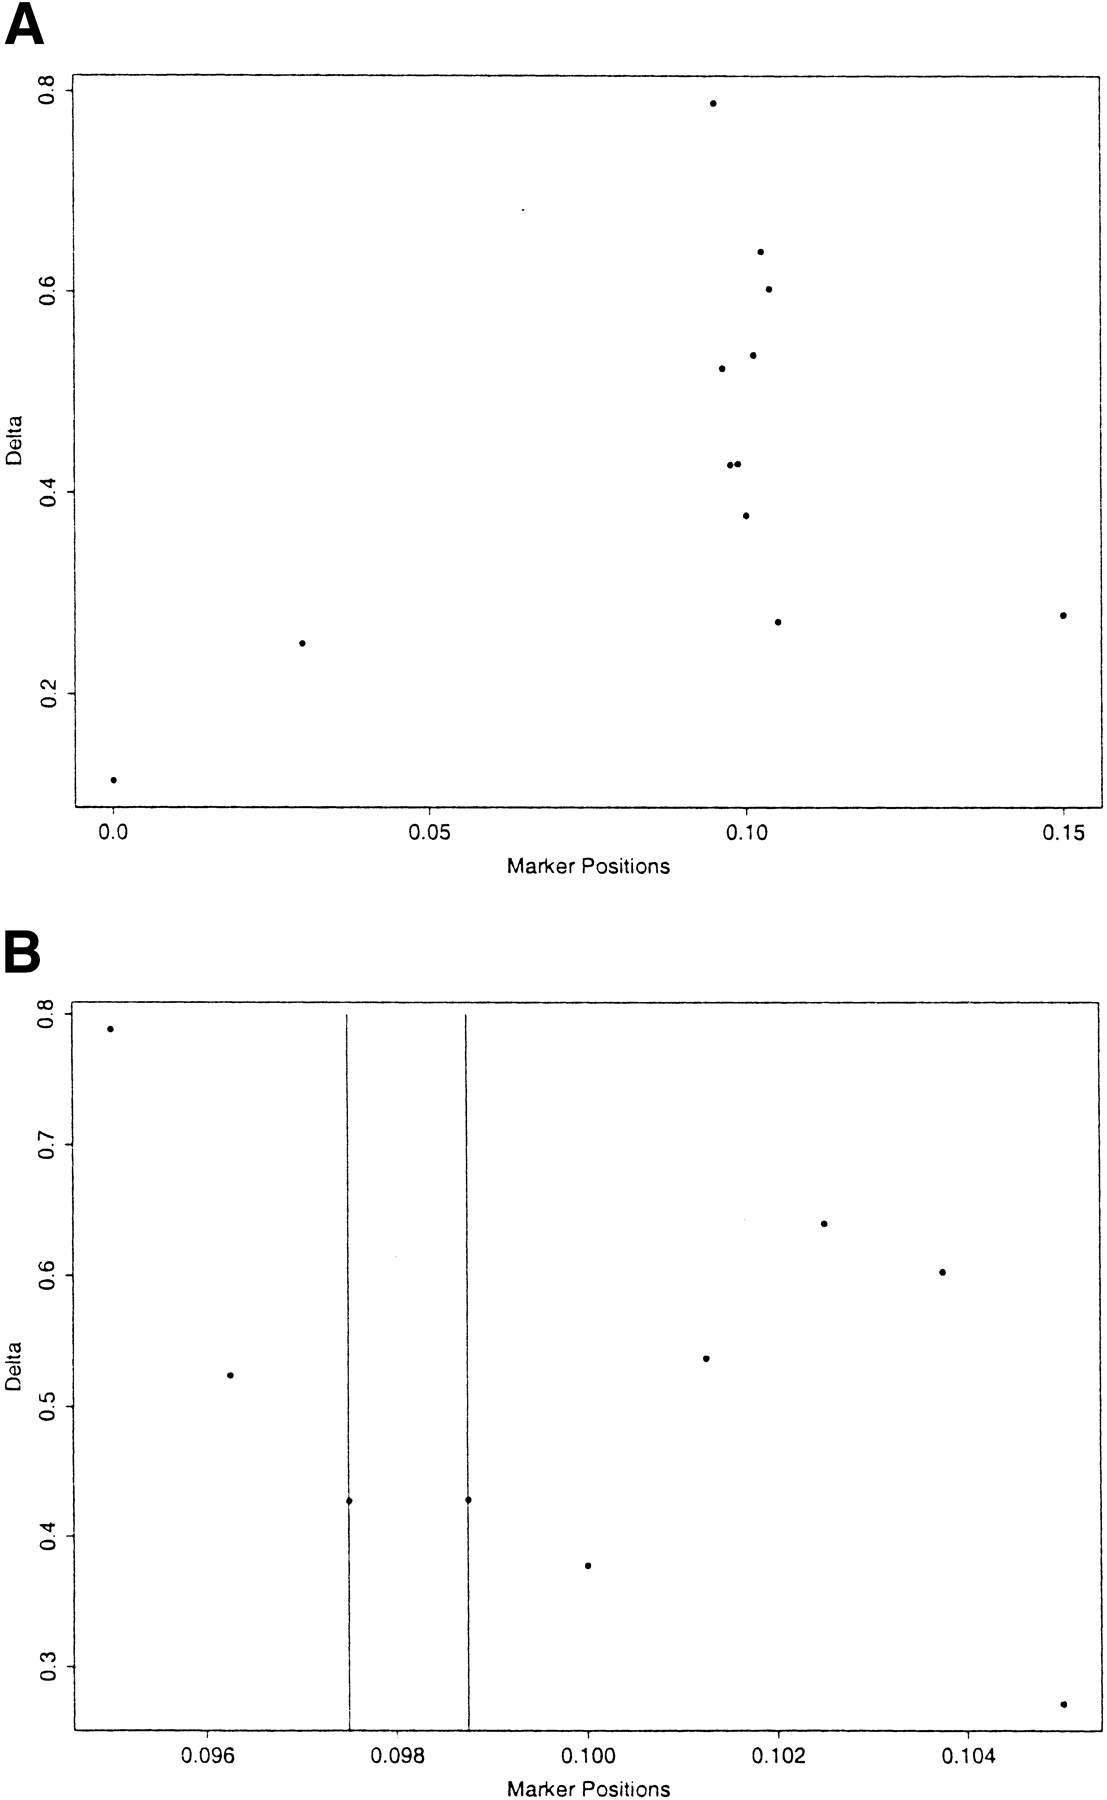
Bayesian Analysis of Haplotypes for Linkage Disequilibrium Mapping

(Downloading may take up to 30 seconds. If the slide opens in your browser, select File -> Save As to save it.)

Click on image to view larger version.

Figure 2.
Figure 2.

(A) δ values for all of the markers in the Friedreich ataxia dataset. (B) δ values for the markers with distances from the disease locus less than 1 cM. The vertical lines indicate the two marker positions flanking the disease gene.

This Article

  1. Genome Res. 11: 1716-1724

Preprint Server