
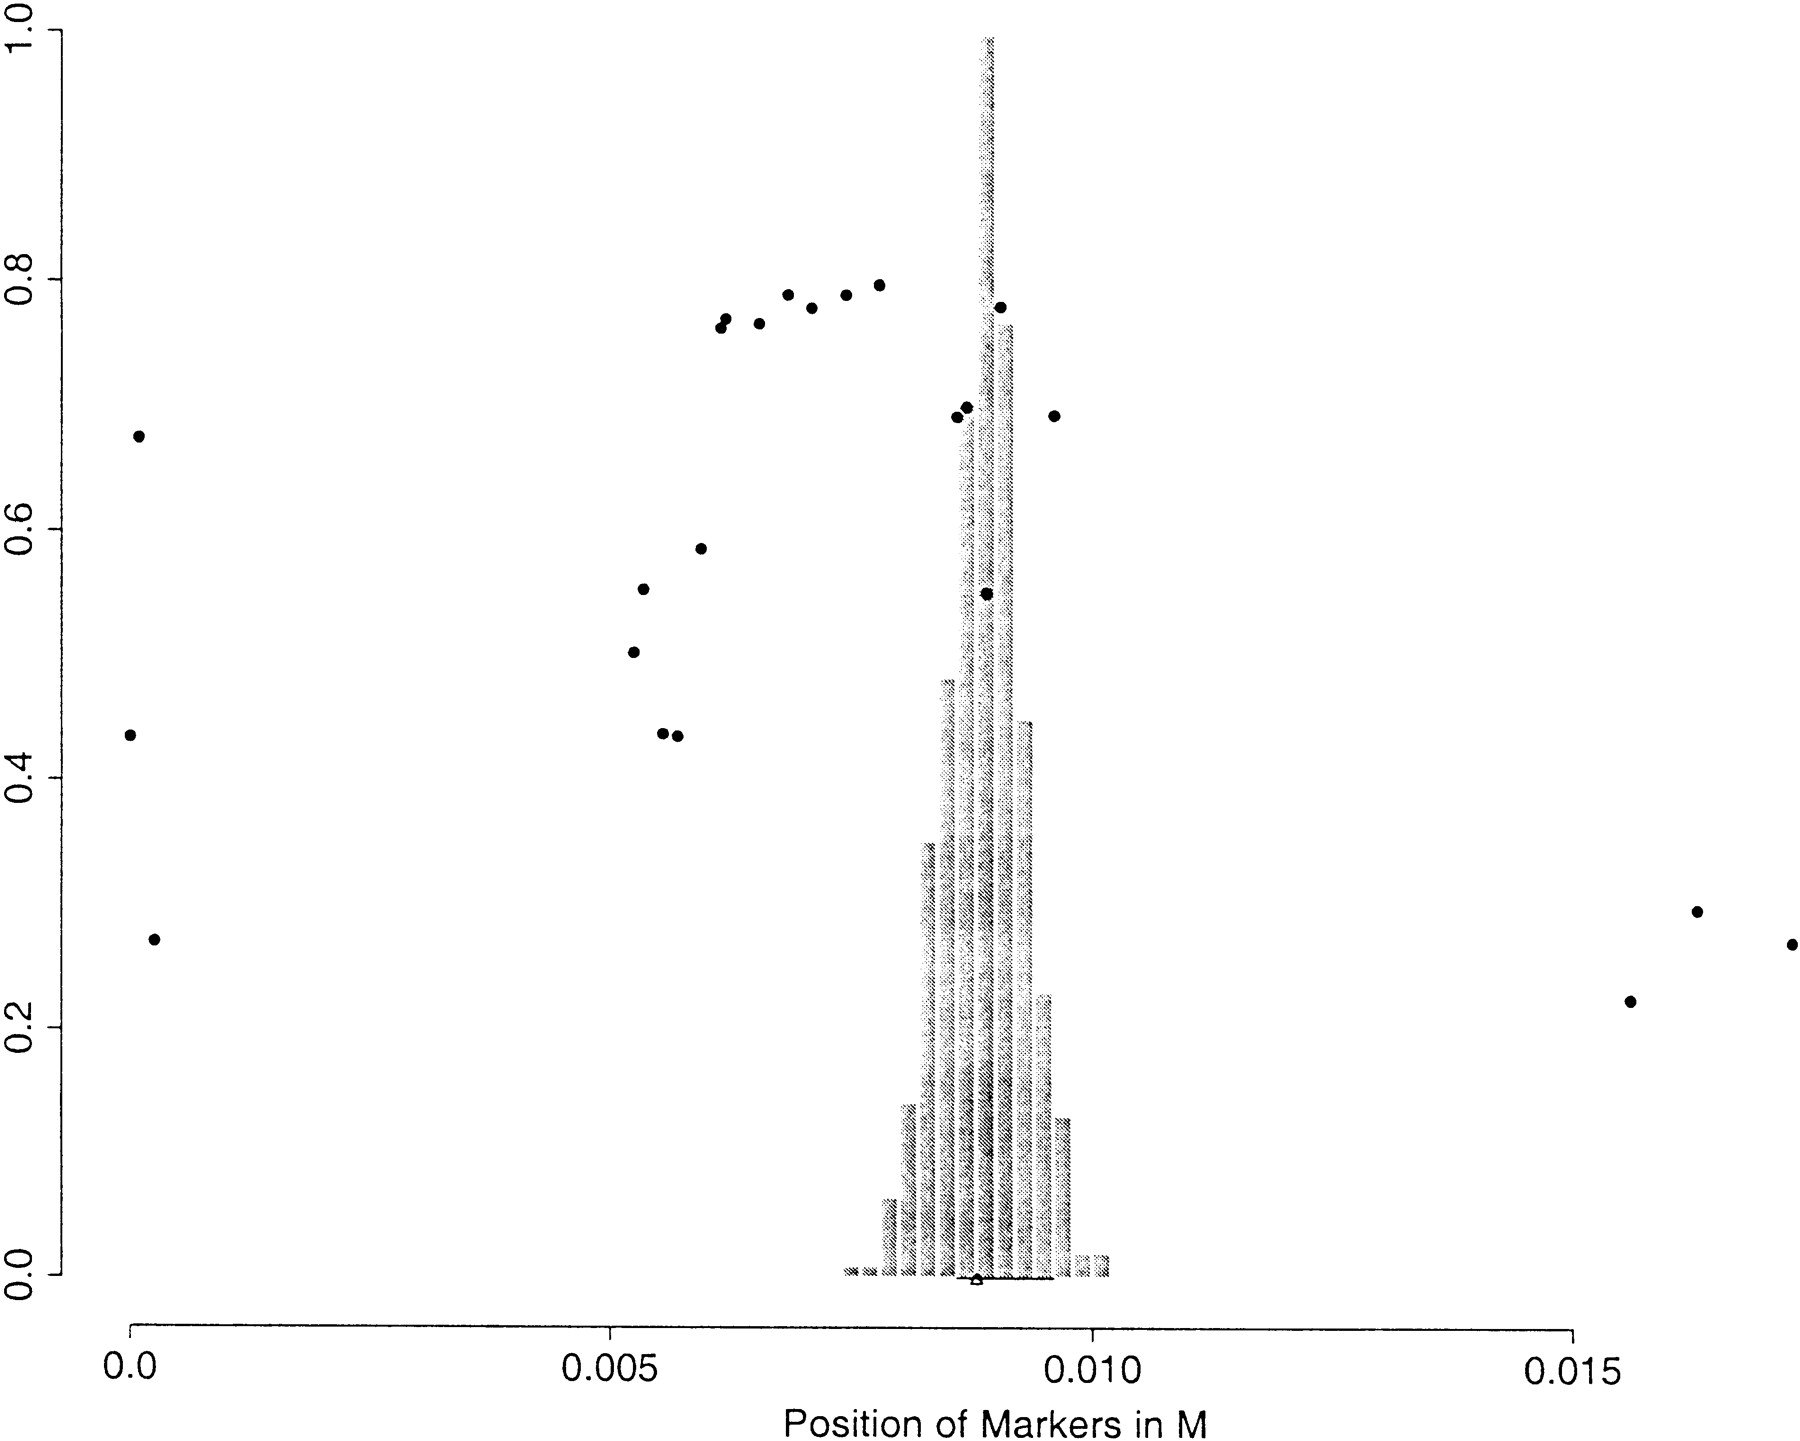
Figure 1.
Histogram of a posterior sample for the location of the disease locus for cystic fibrosis. At the bottom of the figure, the true position of the disease-causing mutation is indicated by a small triangle, and the gene that contains it is indicated with a segment. The dots on the graph represent the δ-values for each marker in the dataset.


