
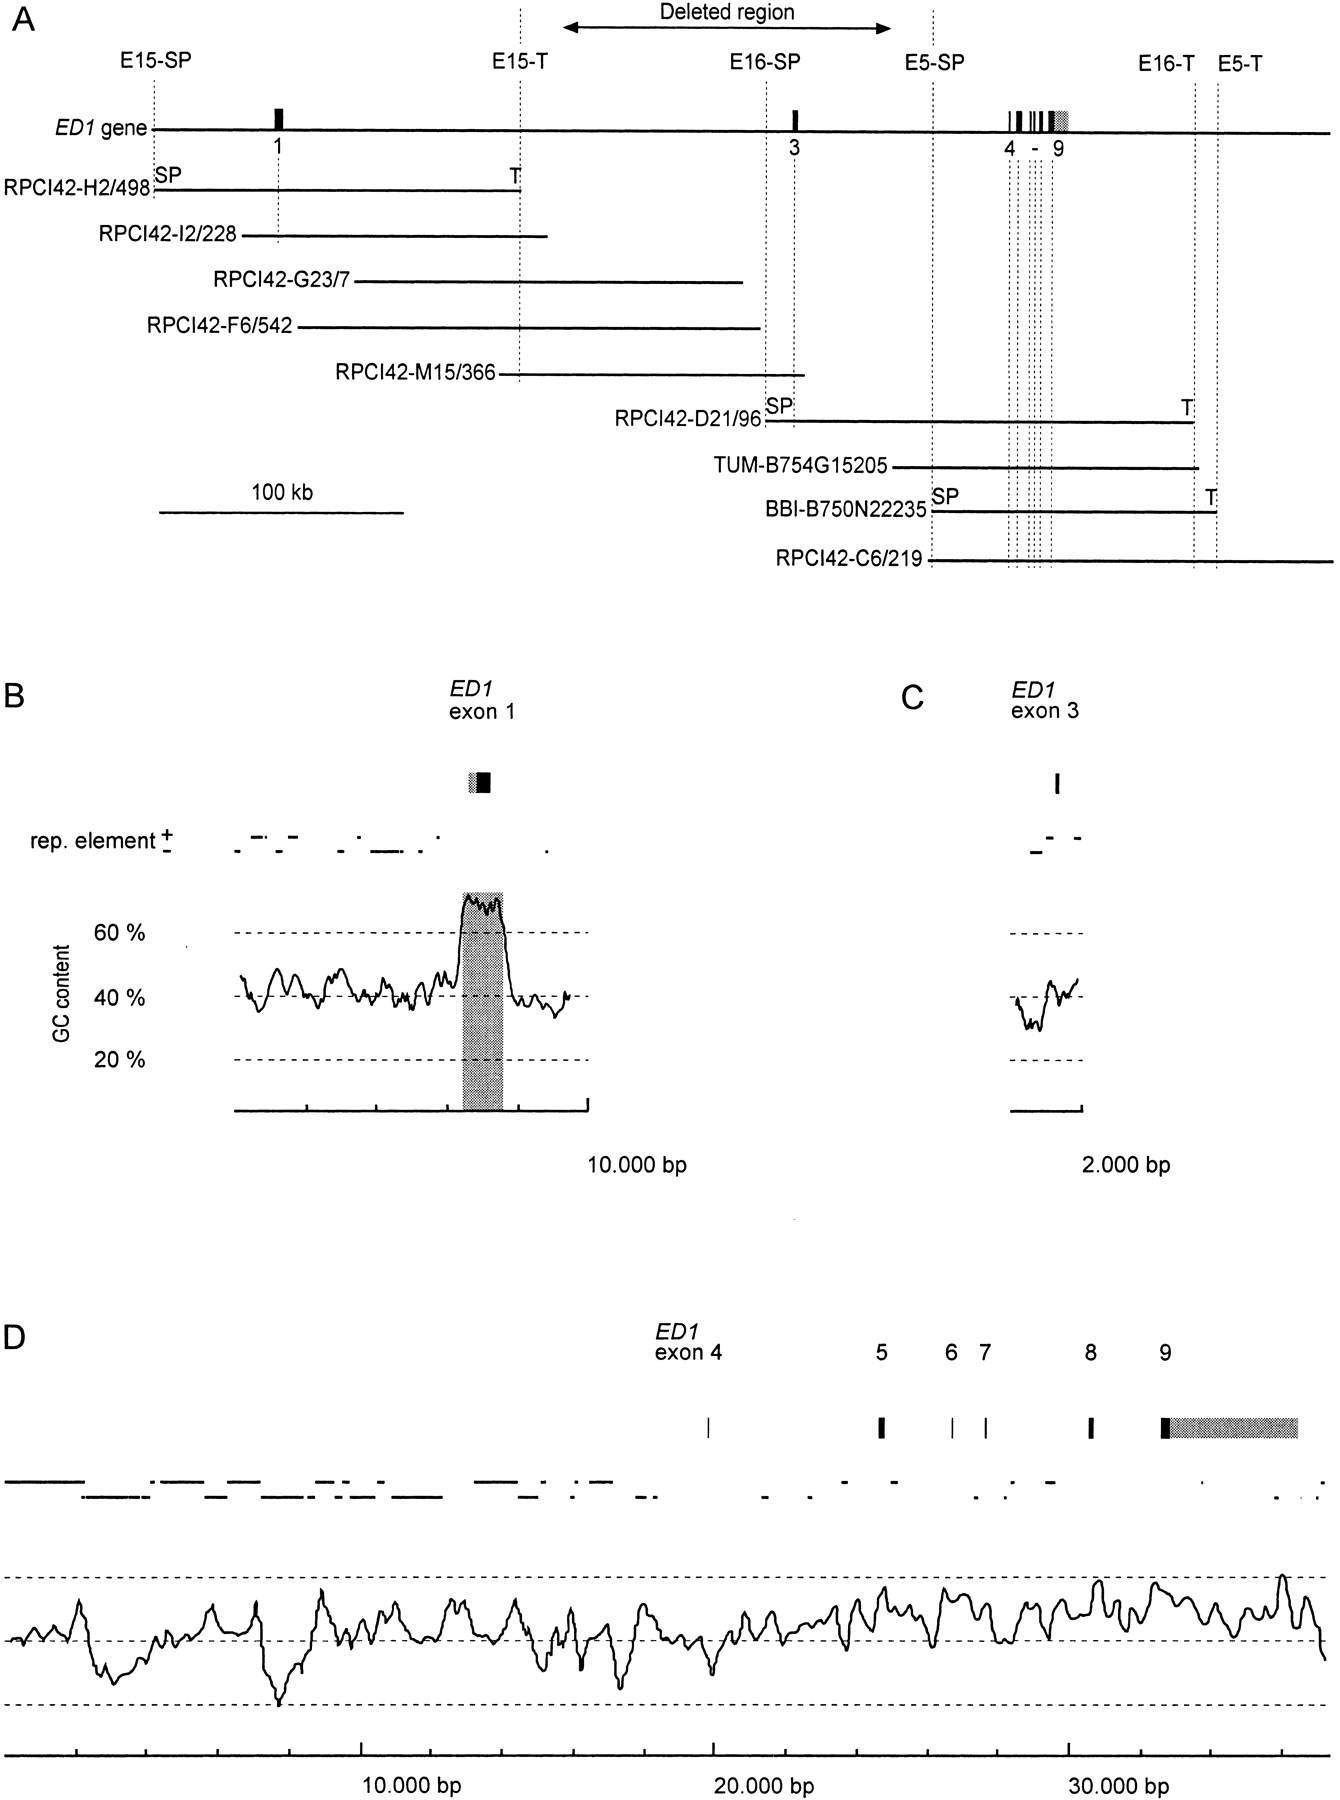
(A) Genomic structure of the bovine ED1 gene. Exons are numbered according to the nomenclature of Bayés et al. (1998). The positions of the isolated BAC clones are represented by horizontal bars in the lower part. The deleted genomic region in ED1-affected cattle is marked by an arrow. Vertical broken lines indicate STS loci used for physical mapping of the BAC contig. (B,C,D) Exons of the ED1 gene are shown as boxes. Untranslated regions are shown in gray, whereas protein-coding parts are shown in black. The positions and orientations of repetitive elements (SINE, LINE, LTR) are indicated by solid lines. In the lower part of the figure, the GC content is shown. A 300-bp window size was used for the calculation of the GC content. The shaded box highlights a CpG island in the region of the promotor and exon 1 of the bovine ED1 gene.


