
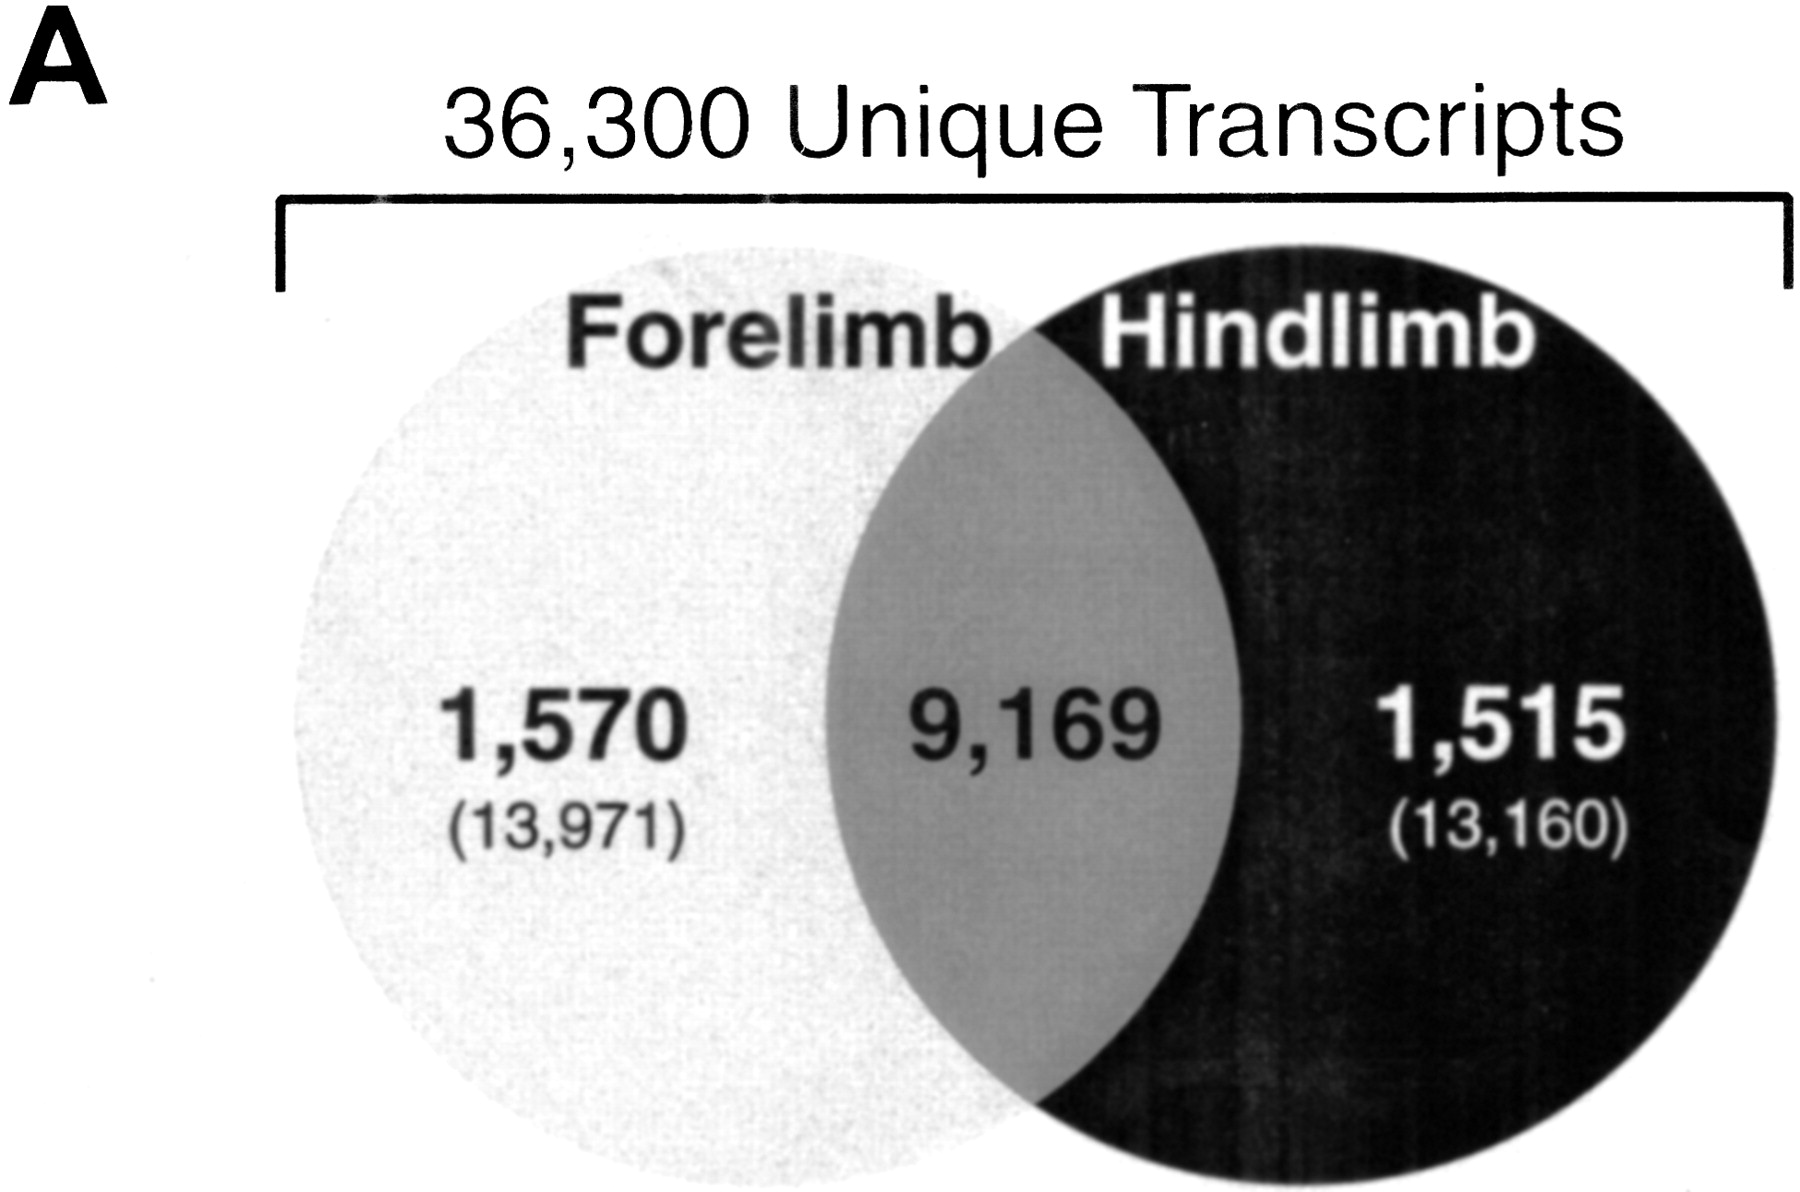

Venn diagram representation of the forelimb and hindlimb SAGE libraries. This figure is not drawn to scale. (A) (Light gray circle) Number of unique tags observed in the forelimb; (black circle) number in the hindlimb; (overlapping fraction) number of unique tags observed in both SAGE libraries; (bold numbers) tags observed more than once; (numbers in parentheses) unique tags, including those observed once. (B) Fraction of unique tags (Y-axis) from the subset of 27,131 unique tags observed in only one SAGE library (light gray and black, not including the overlapping fraction), with a cumulative frequency indicated (X-axis). For example, 97% of the unique tags in only one library were observed two times or less.


