
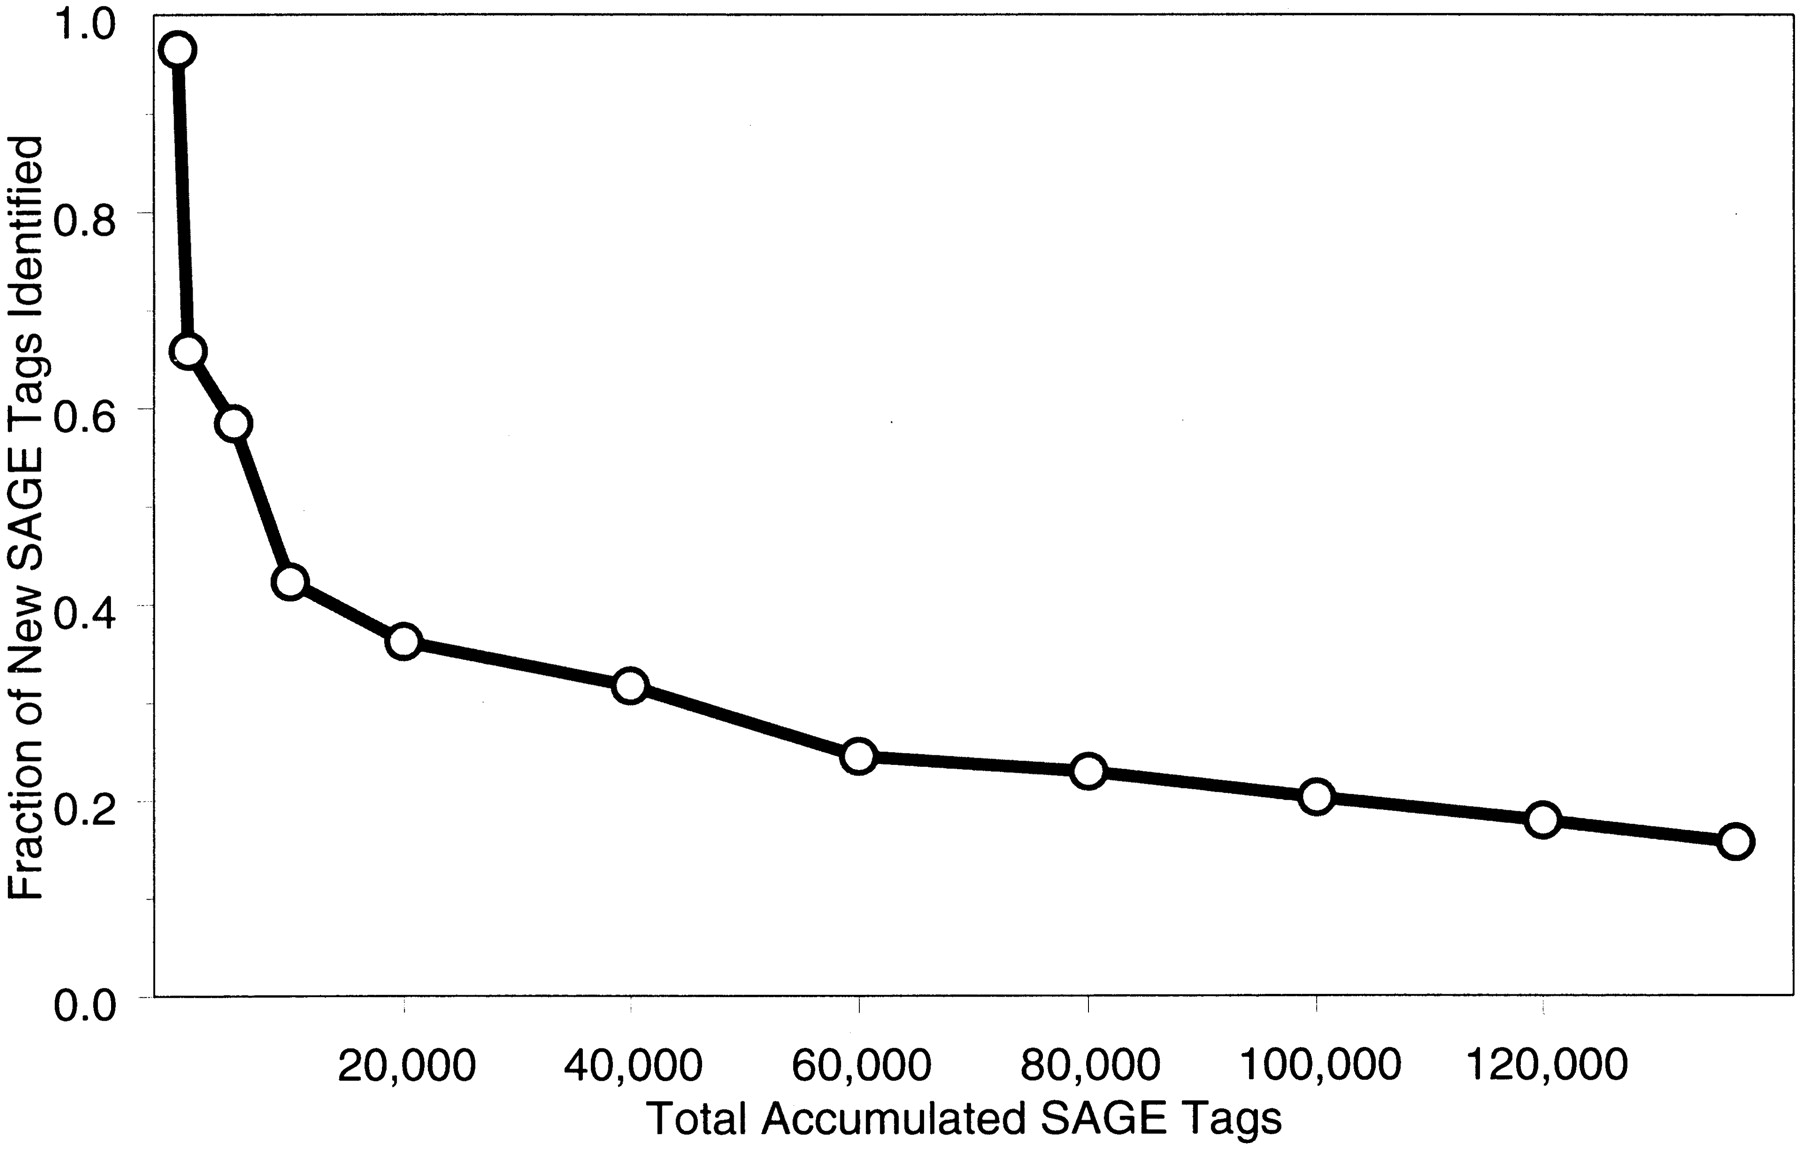
Figure 2.
Fraction of unique SAGE tags added to the database. (X-axis) Cumulative total number of SAGE tags in our combined forelimb/hindlimb database; (Y-axis) average fraction of unique SAGE tags added to the database. eSAGE calculates the fraction of unique SAGE tags extracted from each sequence file. The data points were calculated by averaging sequence file information over the cumulative SAGE tag interval (just after the previous data point and including the current data point). For example, of the last 17,000 tags added to the database (from ∼120,000 to ∼137,000 tags), an average of 16% were unique (or novel entries).


