

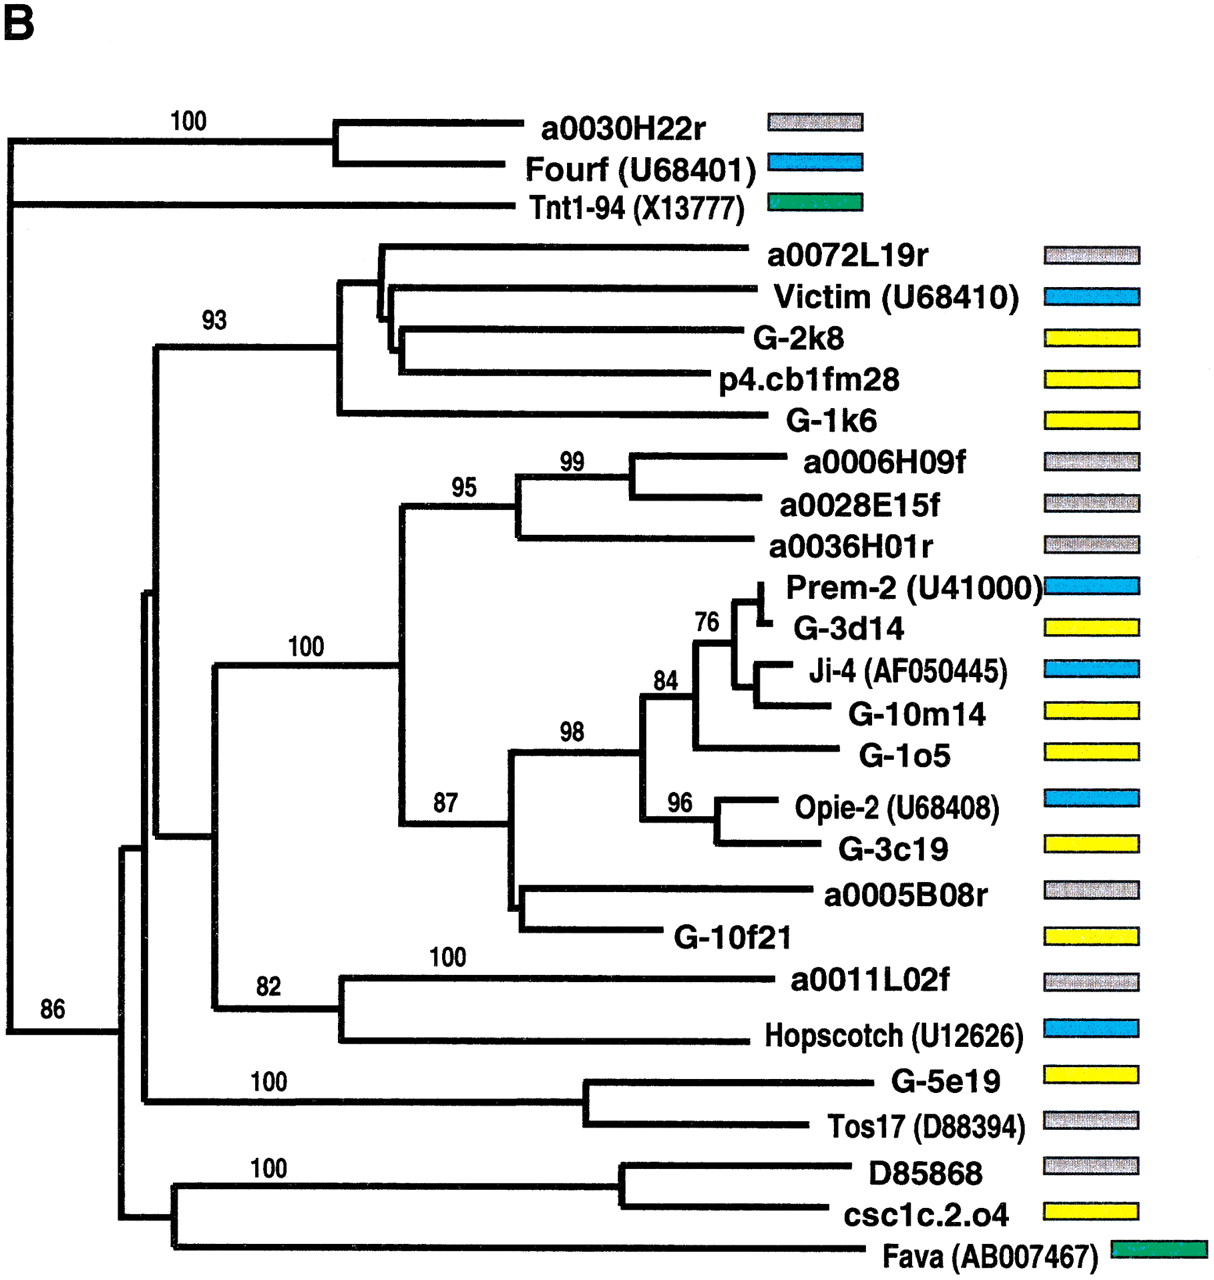
Phylogenetic analysis of LTR-retrotransposon sequences in rice and maize. All DNA sequences were translated into proteins and trimmed to the respective domains, and phylogenetic analyses were performed using the neighbor-joining algorithm from distance matrices according to Kimura's two-parameter method. Branch lengths are proportional to genetic distance. Bootstrap values >50 are indicated as a percentage of 1000 replicates. Maize sequences are indicated by a yellow box to the right of the sequence; rice sequences by a gray box; maize retroelements described previously by a blue box; and retroelements from other species by a green box. The maize sequences were a subset of those in Fig. 4, chosen to represent the major clades on the trees in Fig. 4. Rice sequences with a number preceded by a00 or b00 are from the Clemson University Genome Center (http://www.genome.clemson.edu/); for display purposes, the Clemson sequence identifier OSJNB has been removed from these sequence names. (A) Gypsy-related sequences. Predicted proteins were homologous to a 132-amino acid region of the integrase domain. (B) Copia-related sequences. Predicted proteins were homologous to a 92-amino acid region of the reverse transcriptase domain.


