
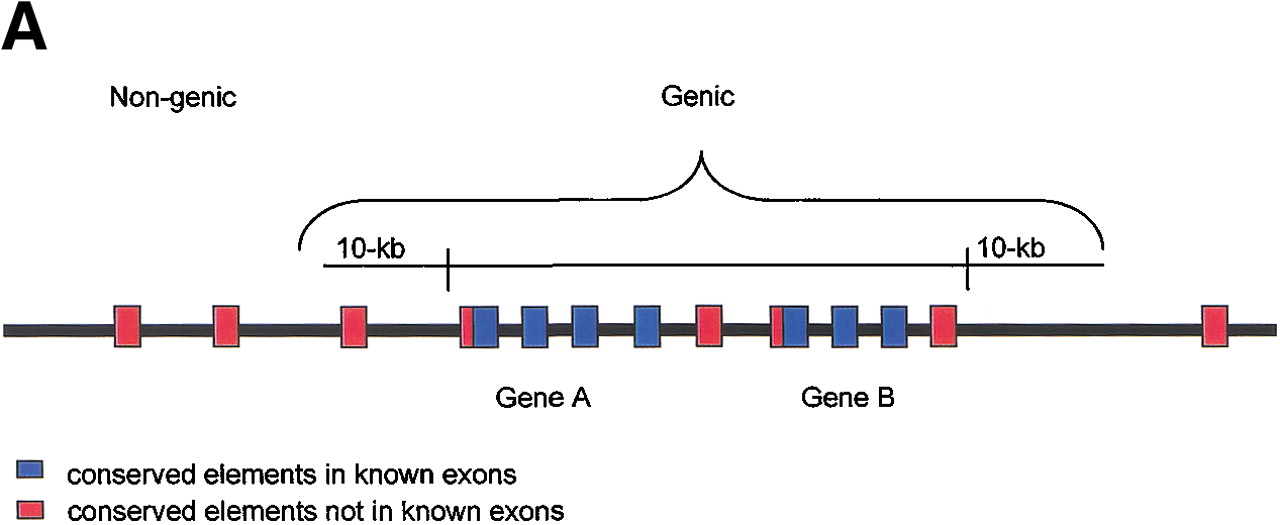
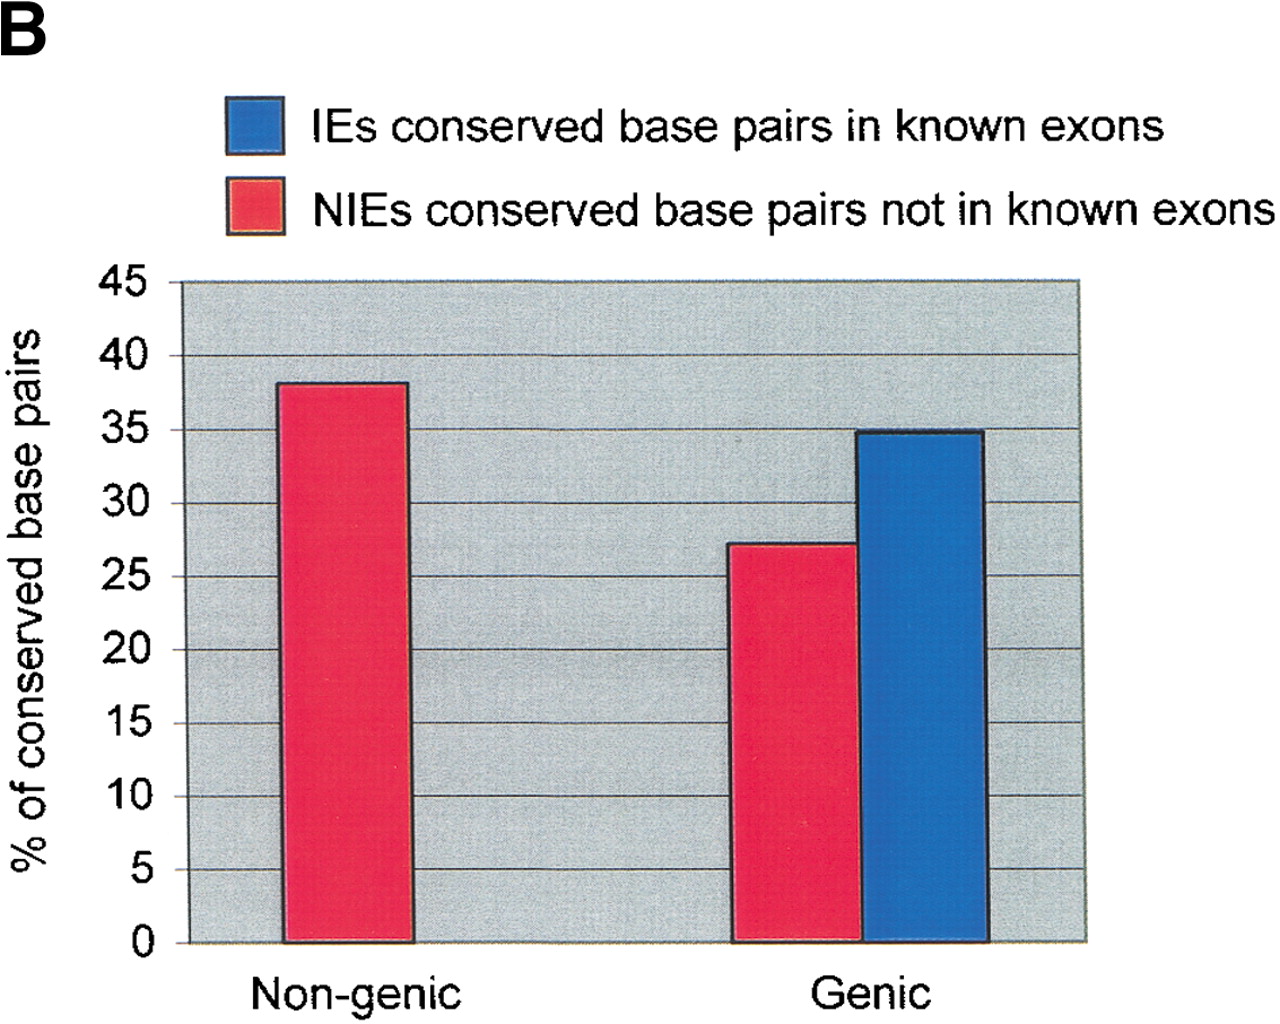
Figure 3.
Distribution analysis of conserved human–mouse elements in genic and nongenic intervals on chromosome 21. (A) Diagram illustrating the definition of genic regions as all sequences ± 10 kb of an annotated chromosome 21 gene. (B) The percent of the base pairs identified as conserved in the human–mouse comparison that are located in nongenic and genic intervals.


