


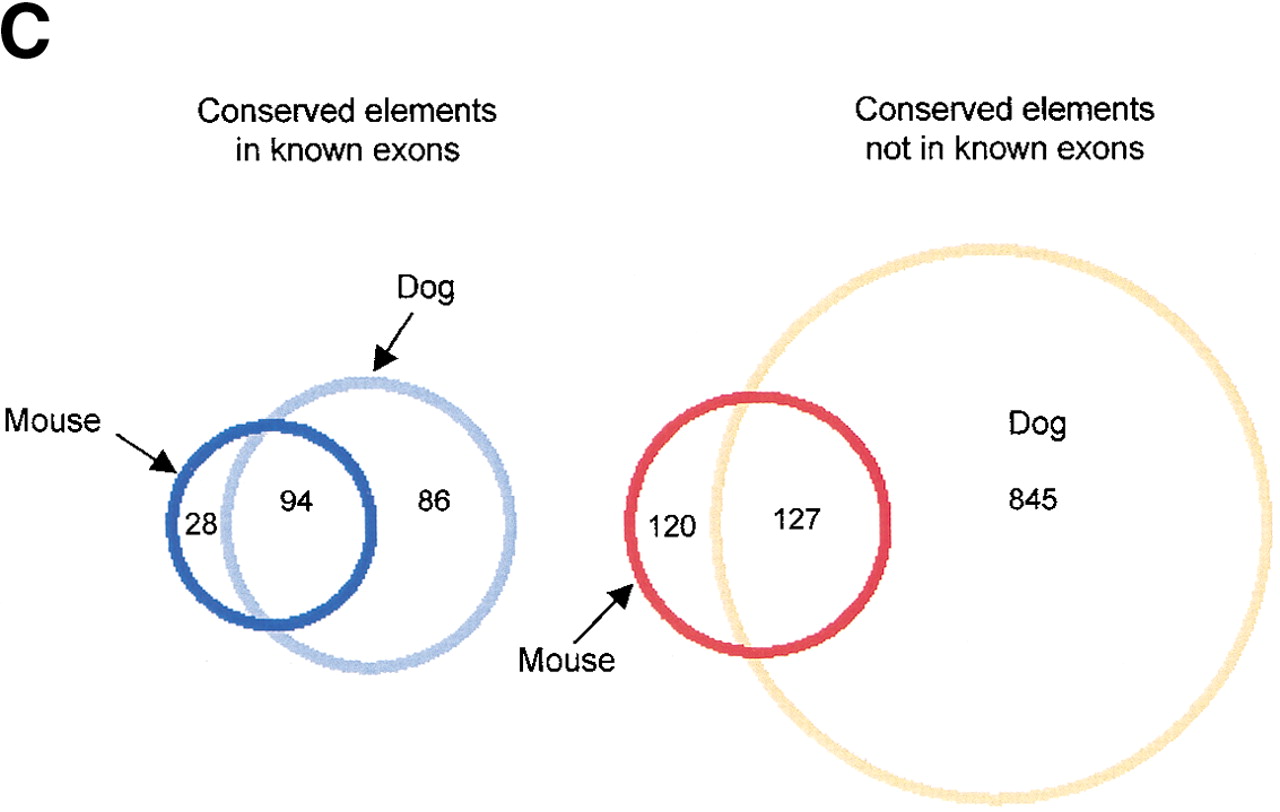
Comparison of the conserved human–mouse and human–dog elements. (A) CONSEQ plots showing the conserved elements identified by hybridizing a 100-kb interval (upstream and encoding the 5′ end of the single-minded [SIM2] gene) with dog and mouse DNA. The conserved elements are shown relative to their position in the human reference sequence (horizontal axis) and their percent conformances (vertical axis). (Top) Conserved elements identified in both the human–dog and human–mouse comparisons (yellow rectangles), identified in only the human–dog comparison (blue rectangles), identified in only the human–mouse comparison (green rectangles), are indicated. In this 100-kb region, 3 of the conserved elements were identified only in human–mouse comparison, 17 of the conserved elements were identified in both comparisons, and 35 of the conserved elements were identified in only the human–dog comparison. (B) Analysis of the percent of human–mouse elements that are also conserved in the dog based on length. (C) Venn diagrams showing that 77% of the human–mouse IE elements and 51% of the human–mouse NIE elements were also identified as conserved elements in the human–dog comparison. In contrast, only 62% of the conserved human–dog IE elements and 13% of the conserved human–dog NIE elements were also identified as conserved elements in the human–mouse comparison.


