
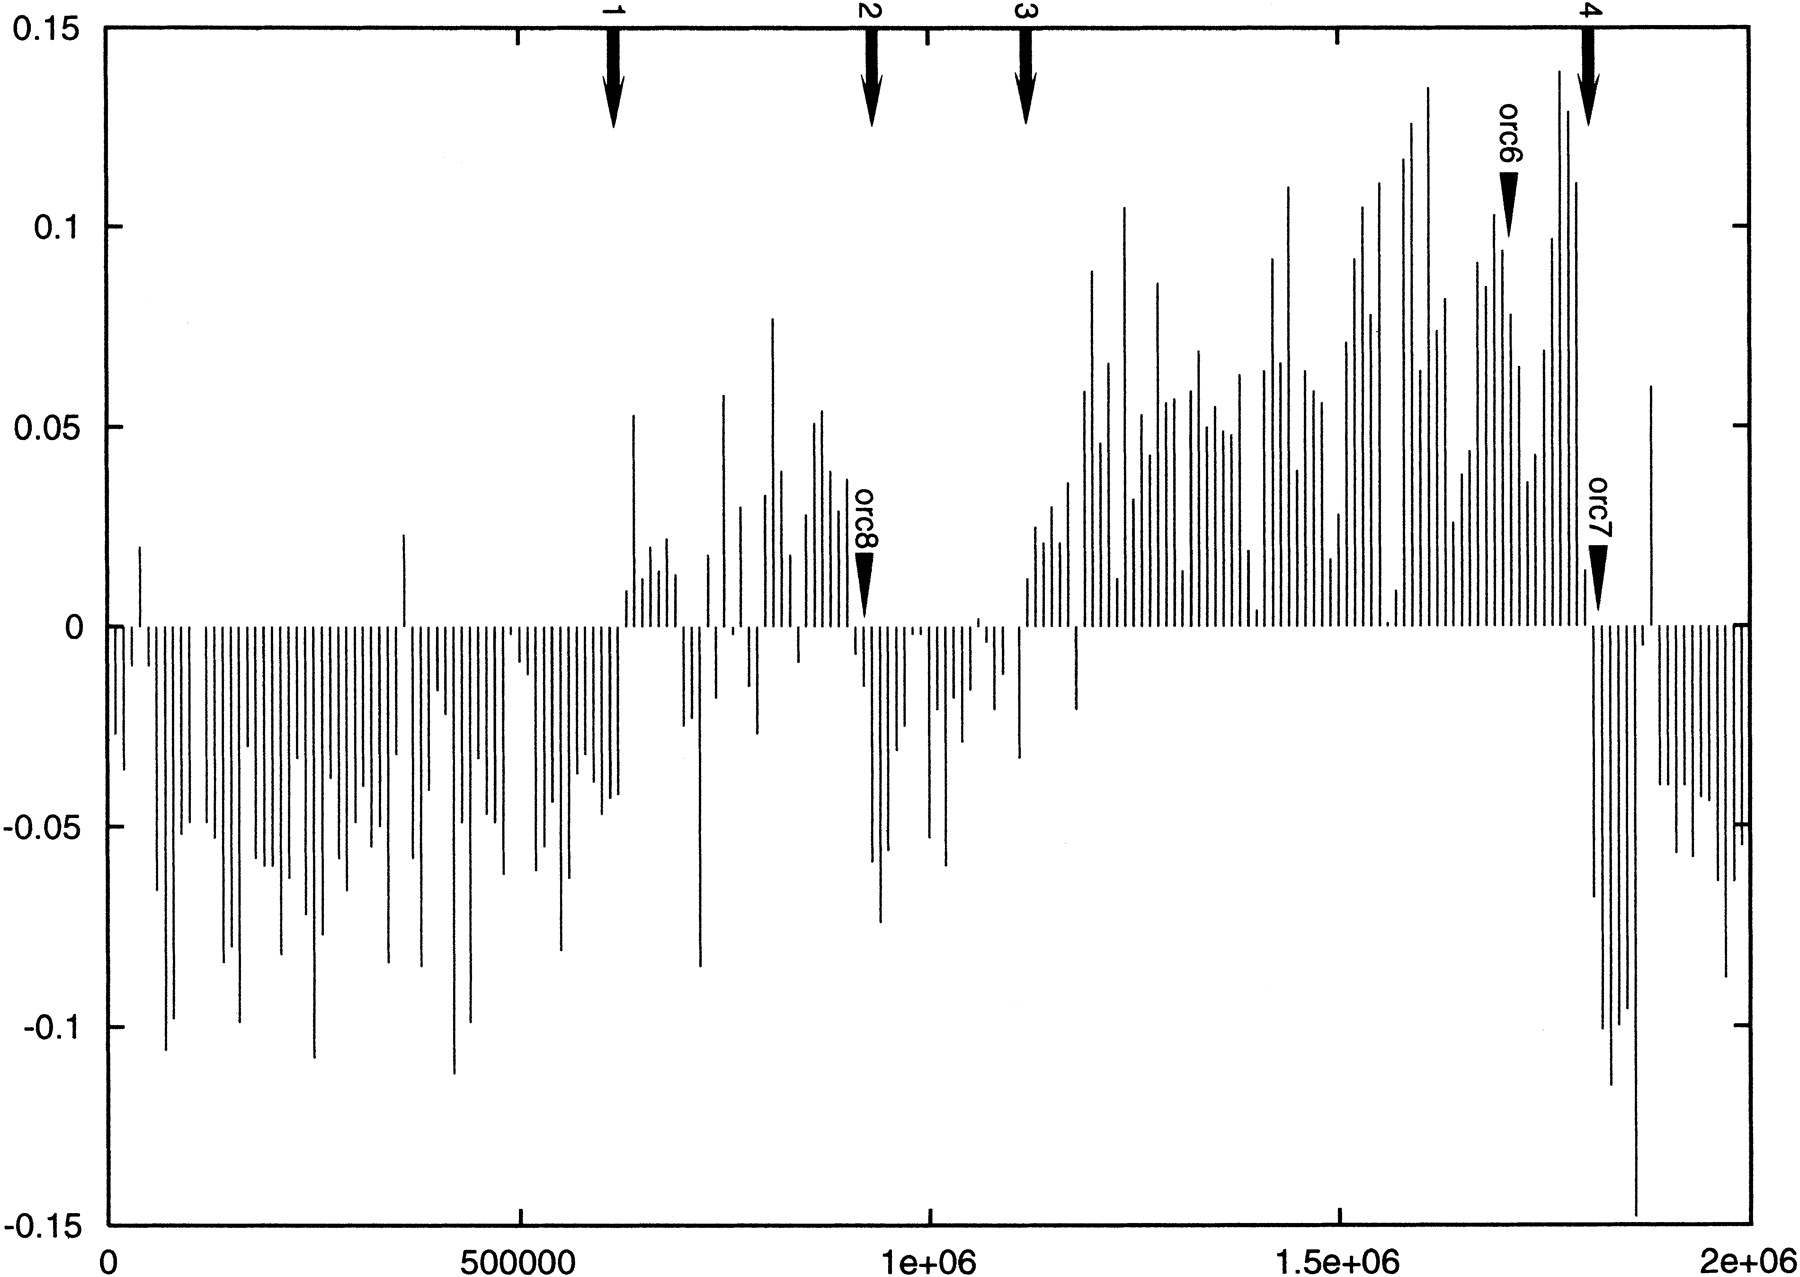
Figure 7.
Plot of the GC skew of the Halobacterium NRC-1 large chromosome. The GC ratio (Y axis) is plotted over the length of the chromosome (X axis). The numbered arrows show inflection points, where the plot crosses the zero mark. The positions of the three chromosomal orc1/cdc6 genes are indicated.


