
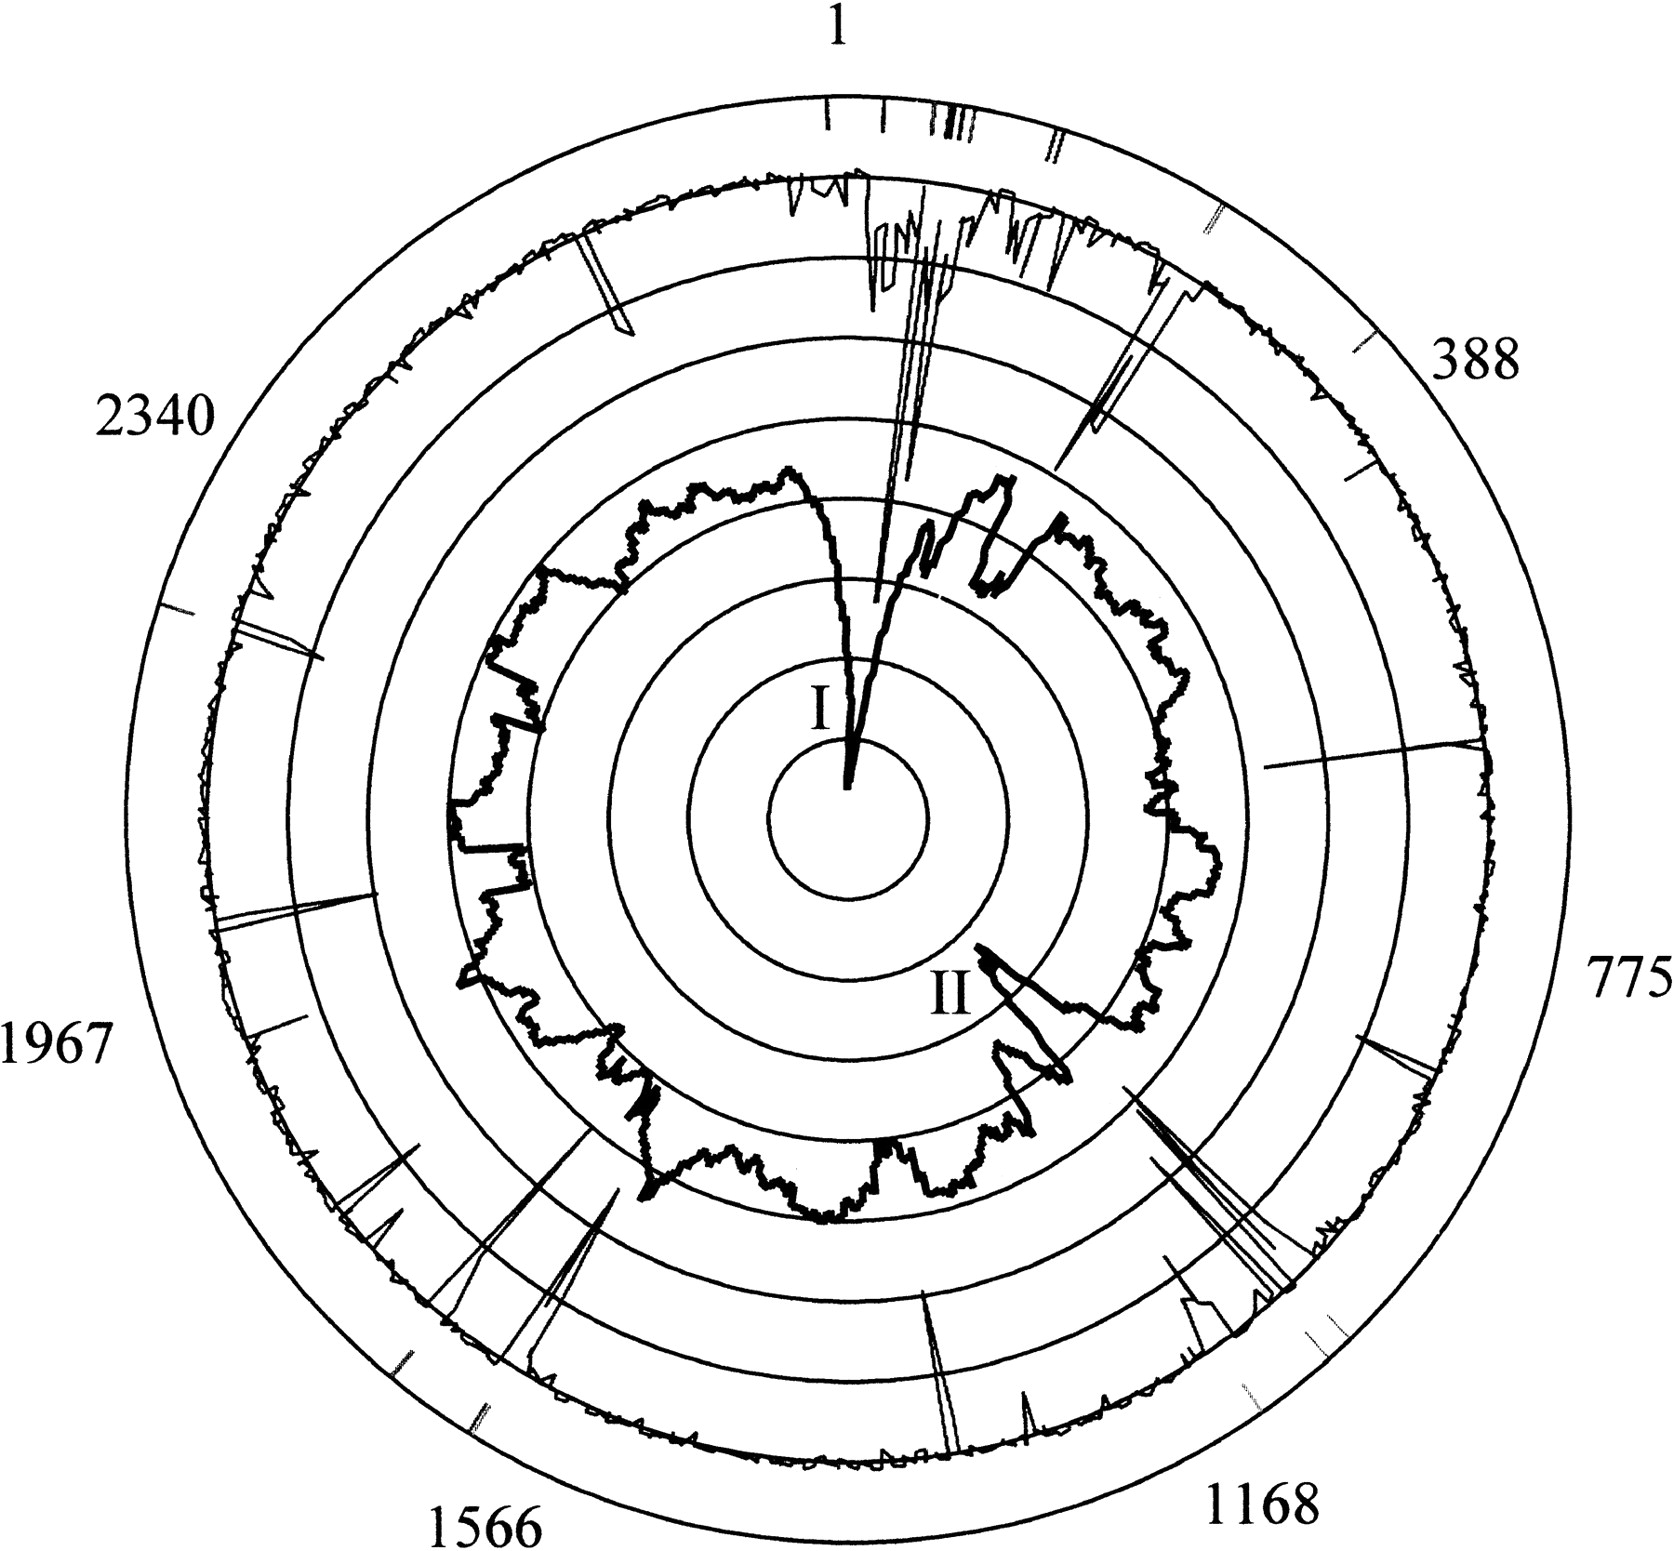
Figure 6.
Circular representation of the Halobacterium NRC-1 chromosome showing the GC composition of ORFs, χ-squared analysis, and location of IS elements. The outer scale refers to ORF identification numbers. Bars associated with the outmost circle denote the position of the chromosomal IS elements. χ-squared analysis is plotted as a thin black line, and average GC content of ORF is the innermost plot in darker black, each against their relative position on the circular map. The Roman numerals I and II inside the plot indicate relatively AT-rich islands.


