
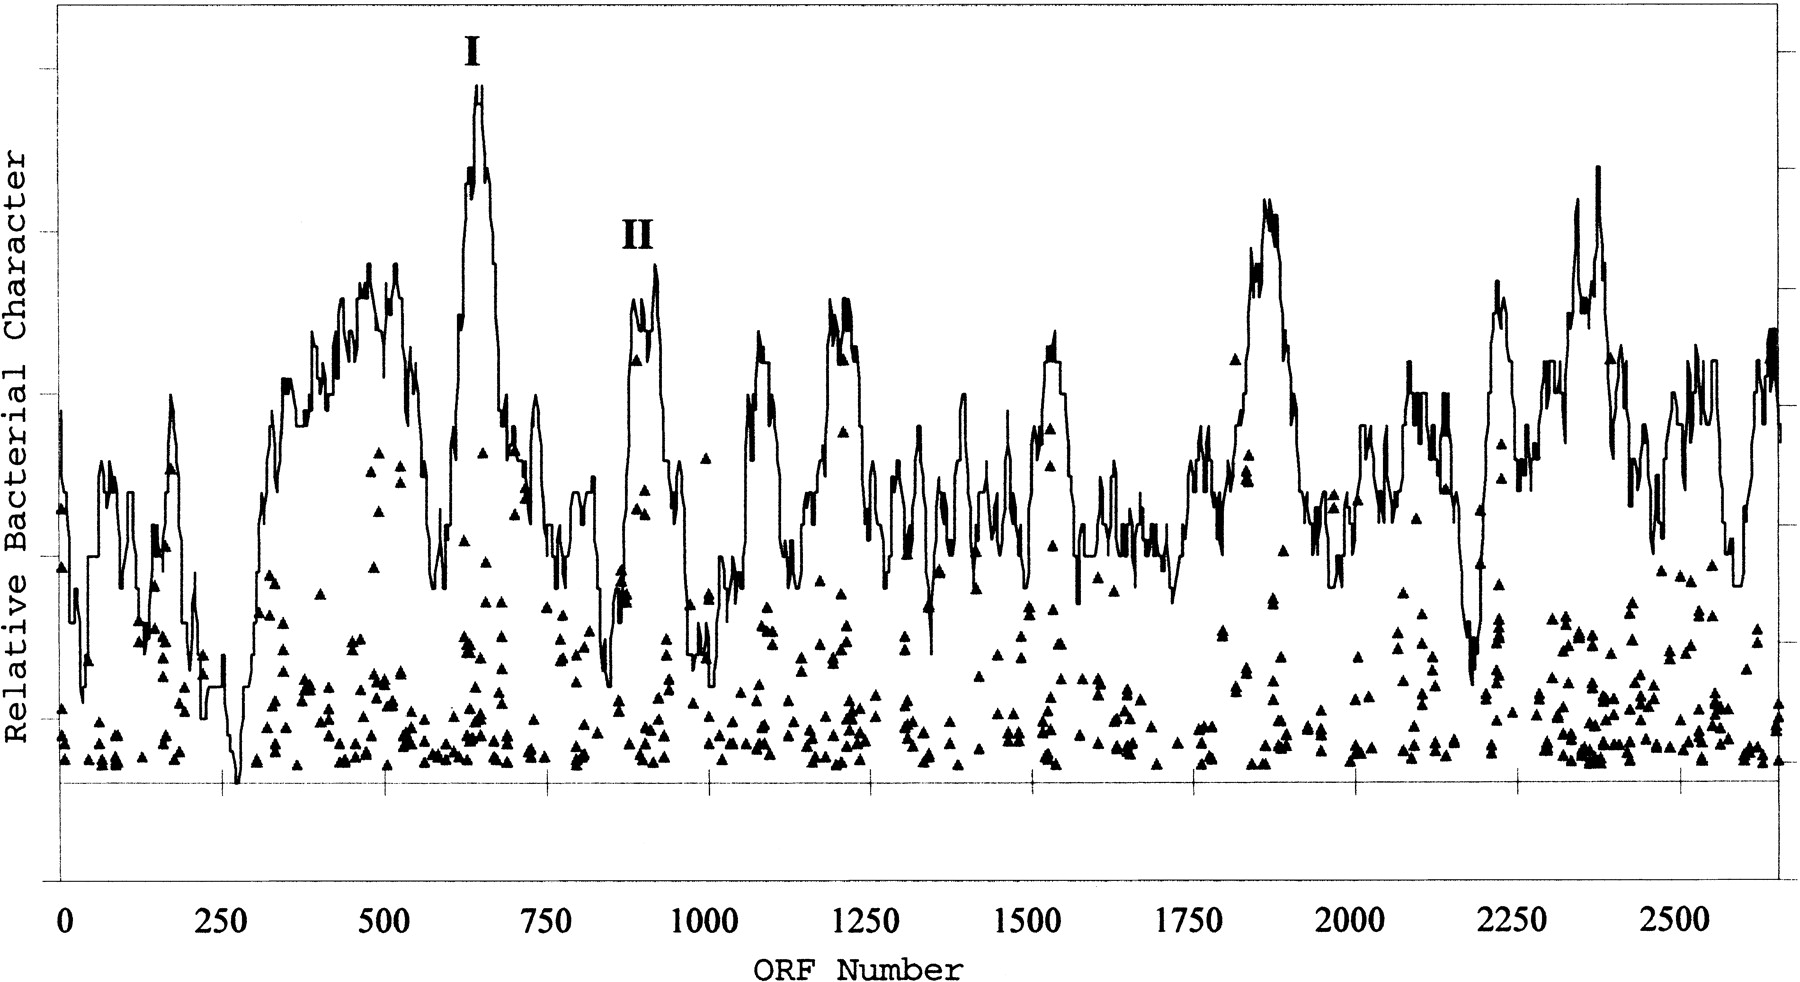
Figure 4.
Graphical representation of the relative amount of homology between predicted proteins in the large chromosome of NRC-1 to those encoded byDeinococcus radiodurans and Bacillus subtilis. NRC-1 chromosomal ORFs are plotted on the X axis. Triangles represent NRC-1 ORFs with BLAST P values <e −29, with more significant scores higher on theY axis. Average bacterial character is shown by the percentage of predicted ORFs in a 40-ORF window that showed BLAST P values of <1 × 10⁻¹⁰. The labeled peaks correspond to regions harboring genes encoding NADH dehydrogenase (I) and menaquinone biosynthesis (II), components of the electron transport chain.


