
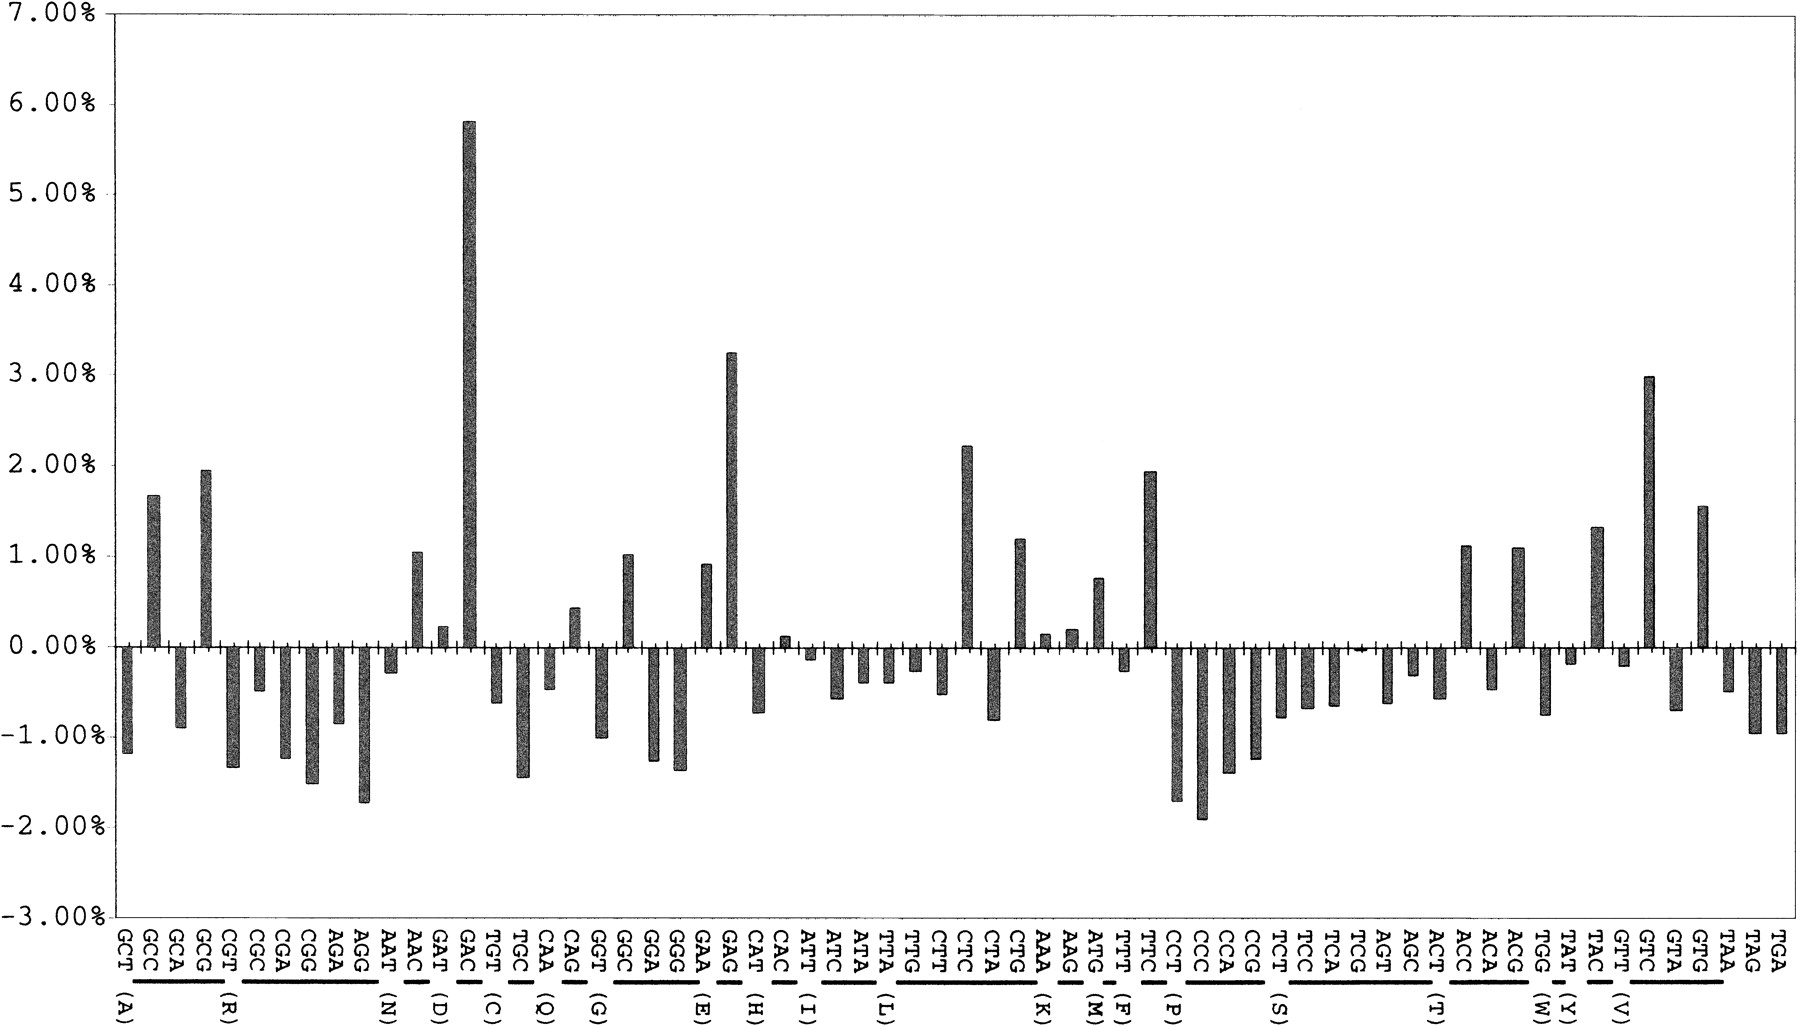
Figure 3.
Codon bias plot showing differences in expected triplet frequencies. Each of the 64 triples is plotted along the X axis with one-letter amino acid designations identifying which amino acid a particular group of triplet represents. Results are normalized according to GC composition. The deviation from the expected percentage is plotted on the Y axis.


