
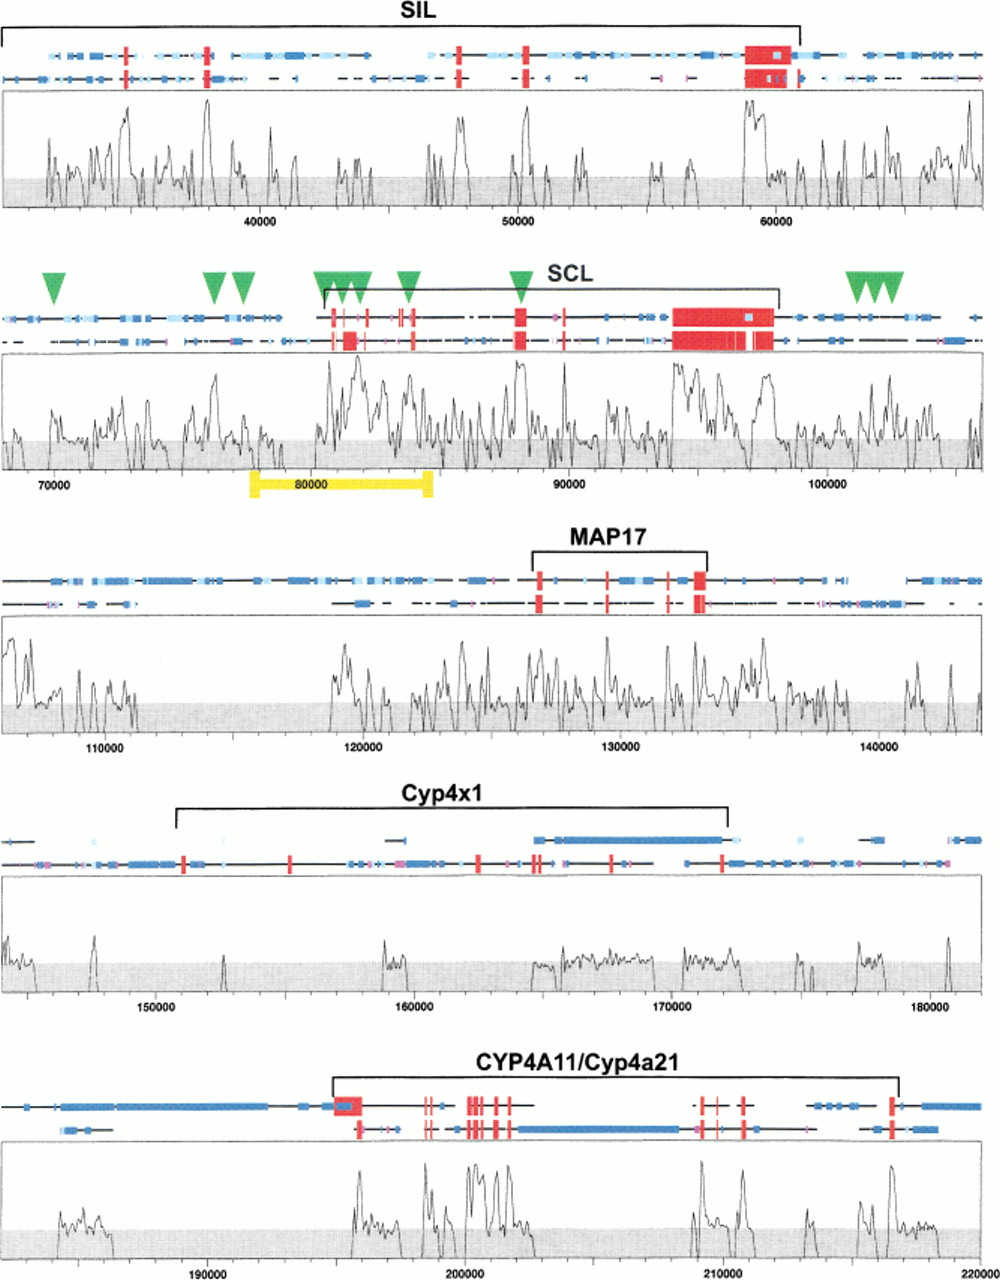
SynPlot analysis of the human and mouse SCL loci. Human and mouse clones starting with the last five exons of SIL, and ranging to beyond the CYP4A11/Cyp4a21 genes, were aligned using Dialign. The alignment, together with locus features, was displayed using SynPlot. Numbers on the horizontal axis represent distance (nucleotides) from the beginning of the aligned file. Numbers on the vertical axis represent the proportion of identical nucleotides within a 49 nt window, moved by 25 nt increments across the entire alignment. Hence, regions with gaps of >50 bp show 0% identity. The horizontal lines above the profile represent the human and mouse sequences and illustrate the position of gaps introduced to permit optimum alignment. Red boxes show exon positions, and the smaller boxes represent repeats as follows: (dark blue) LINEs,(light blue) SINEs, (magenta) tandem repeats. Green arrowheads indicate the positions of previously mapped DNaseI hypersensitive sites, and the yellow bar delimits the portion of the profile shown in Figure 4. Gray shading indicates background similarity of ≤25%.


