
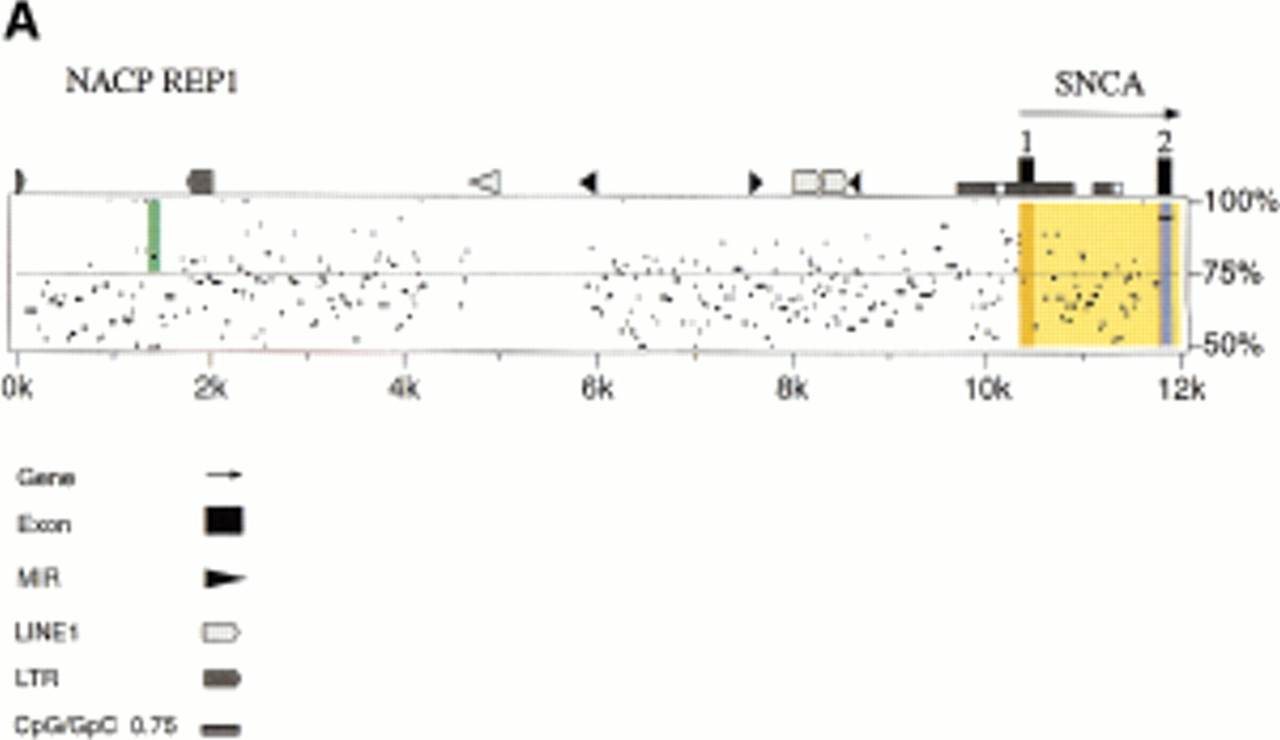

(A) Percentage identity plot (PIP) of human and mouse genomic sequence upstream of the first coding exon of SNCA andSnca. The location of SNCA noncoding and coding exons (orange and blue shading, respectively), introns (yellow shading), and the NACP-REP1 repeat (green shading; half bar) are indicated. A scale representing the degree of sequence identity, indicated as a percentage, is located at the right of each row. Human repetitive elements identified in the human sequence are indicated along the top of the homology window and are described in the key. (B) Alignment of the human NACP-REP1 (126 nt) and mouse (63 nt) repeat by pairwise comparison using the ALIGN program (http://dot.imgen.bcm.tmc.edu:9331/seq-search/alignment.html).


