
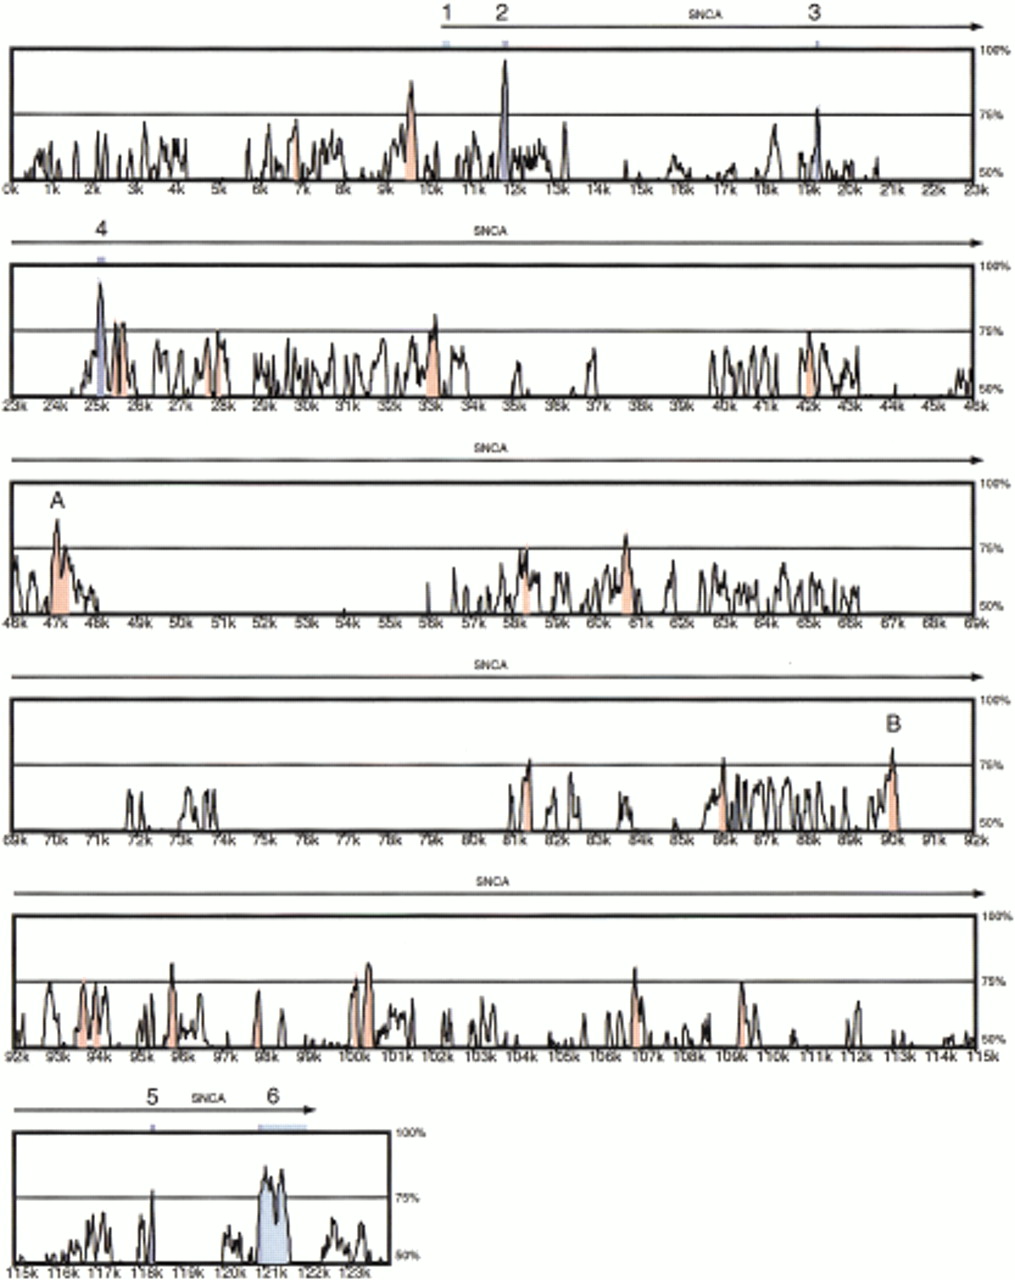
Figure 2.
Global alignment of human SNCA and mouse Snca. Numbers on the vertical axis represent the proportion of identical nucleotides in a 100-bp window for a point on the plot. Numbers on the horizontal axis indicate the nucleotide position from the beginning of the human genomic sequence. Peaks shaded in blue correspond to theSNCA/Snca coding regions. Peaks shaded in light blue correspond to SNCA/Snca mRNA untranslated regions. Peaks shaded in red correspond to evolutionary-conserved regions (ECRs), defined as areas where the average identity is >75%.


