
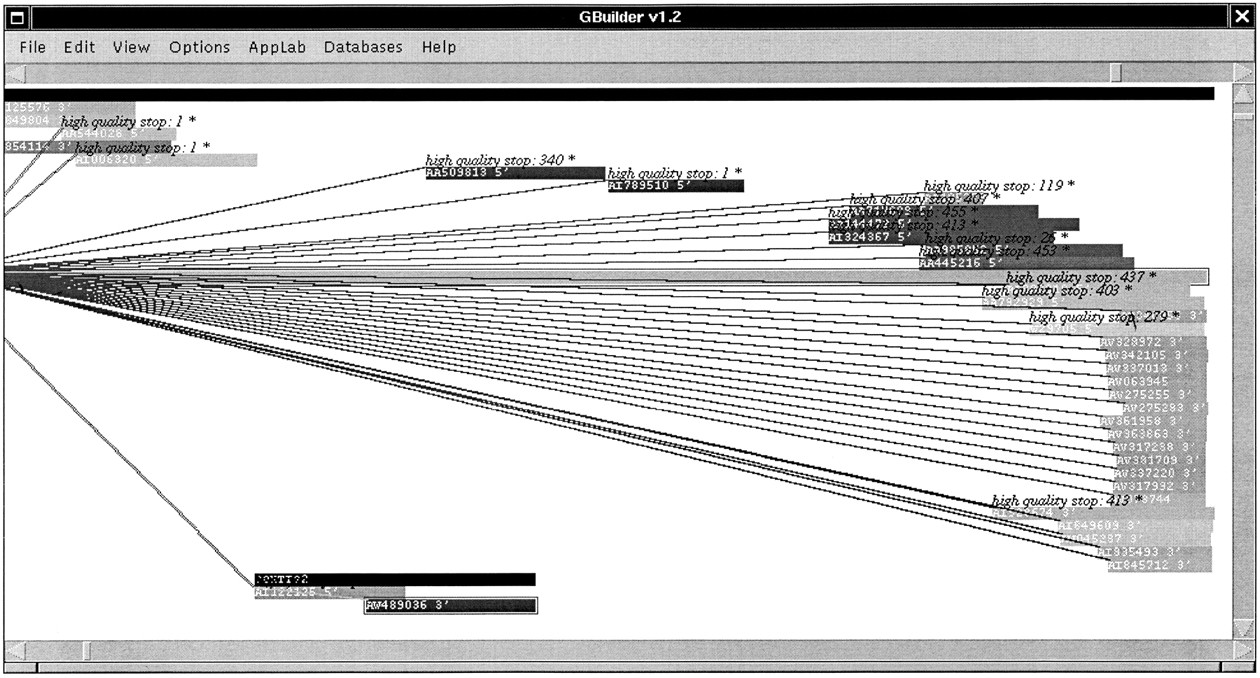
Figure 3.
Sequences that are linked with the longest sequence (U10115 mouse EuroGeneIndex super cluster) are connected by drawing a line between them. Sequences are colored by the number of links they have to other sequences. Sequence quality annotation (measured last high quality base) is shown on top of the sequence.


