
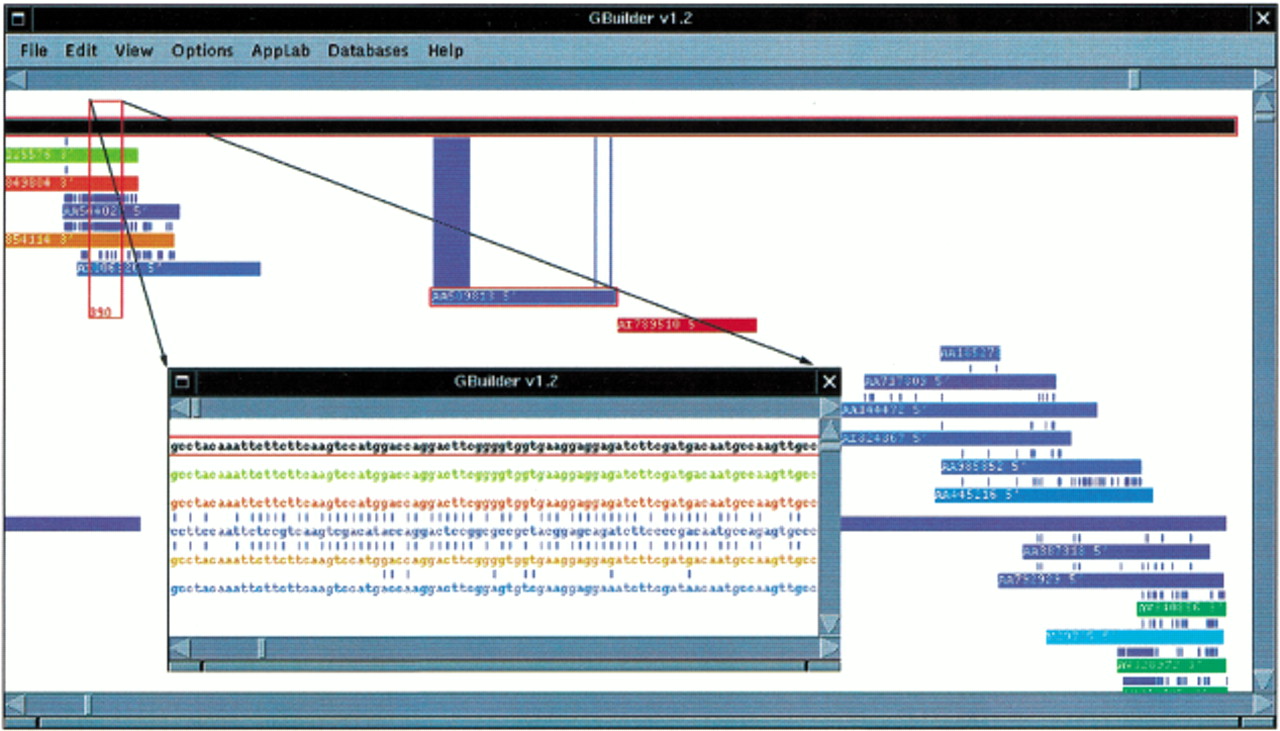
Figure 1.
EuroGeneIndex super cluster from the mouse EST/mRNA database (accession no. U10115). Dissimilarities between adjacent and selected sequences are highlighted. A portion from the Main window, as indicated by the rectangle, can be shown in the other window. Sequences are color coded by clone library.


