
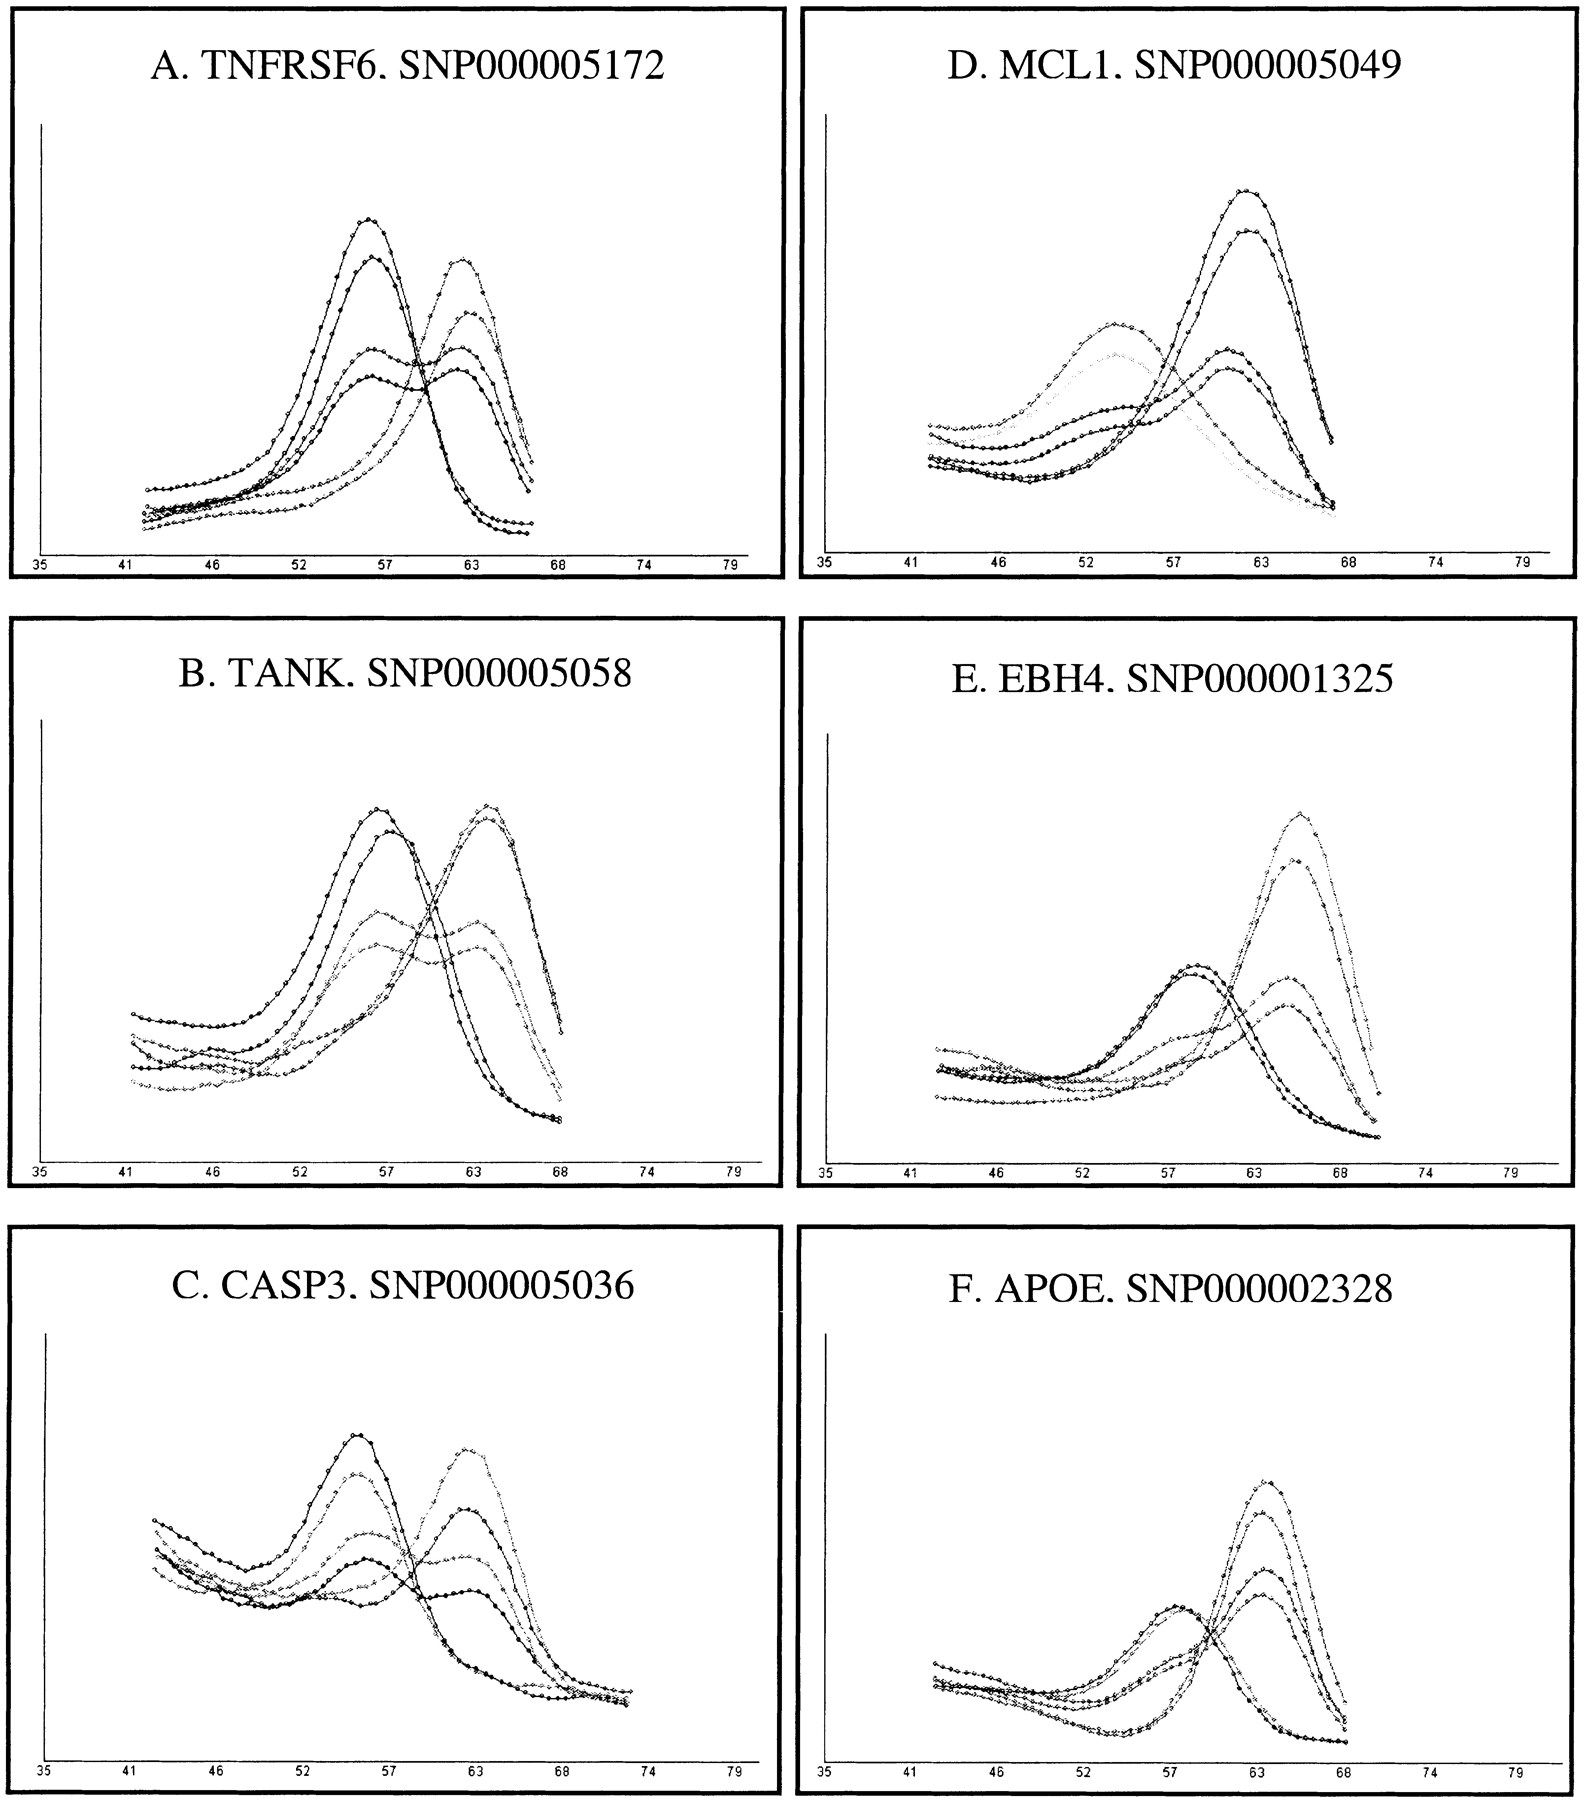
Example genotyping results are shown for six different SNPs scored by DASH, demonstrating assay reproducibility. A, B, andC are quality 1 assays. D, E, and Fare quality 2 assays. In each case, results are plotted for three individuals (one homozygote for each allele, and a heterozygote) genotyped on two separate occasions. High-temperature single peaks represent homozygous samples matched to the utilized probe. Low-temperature single peaks represent homozygous samples mismatched to the utilized probe. Curves with both high- and low-temperature peaks represent heterozygous samples. All plots show the negative first derivative of fluorescence versus temperature. The gene symbols as well as SNP accession numbers for each assay from HGBASE (http://hgbase.cgr.ki.se) are shown.


