
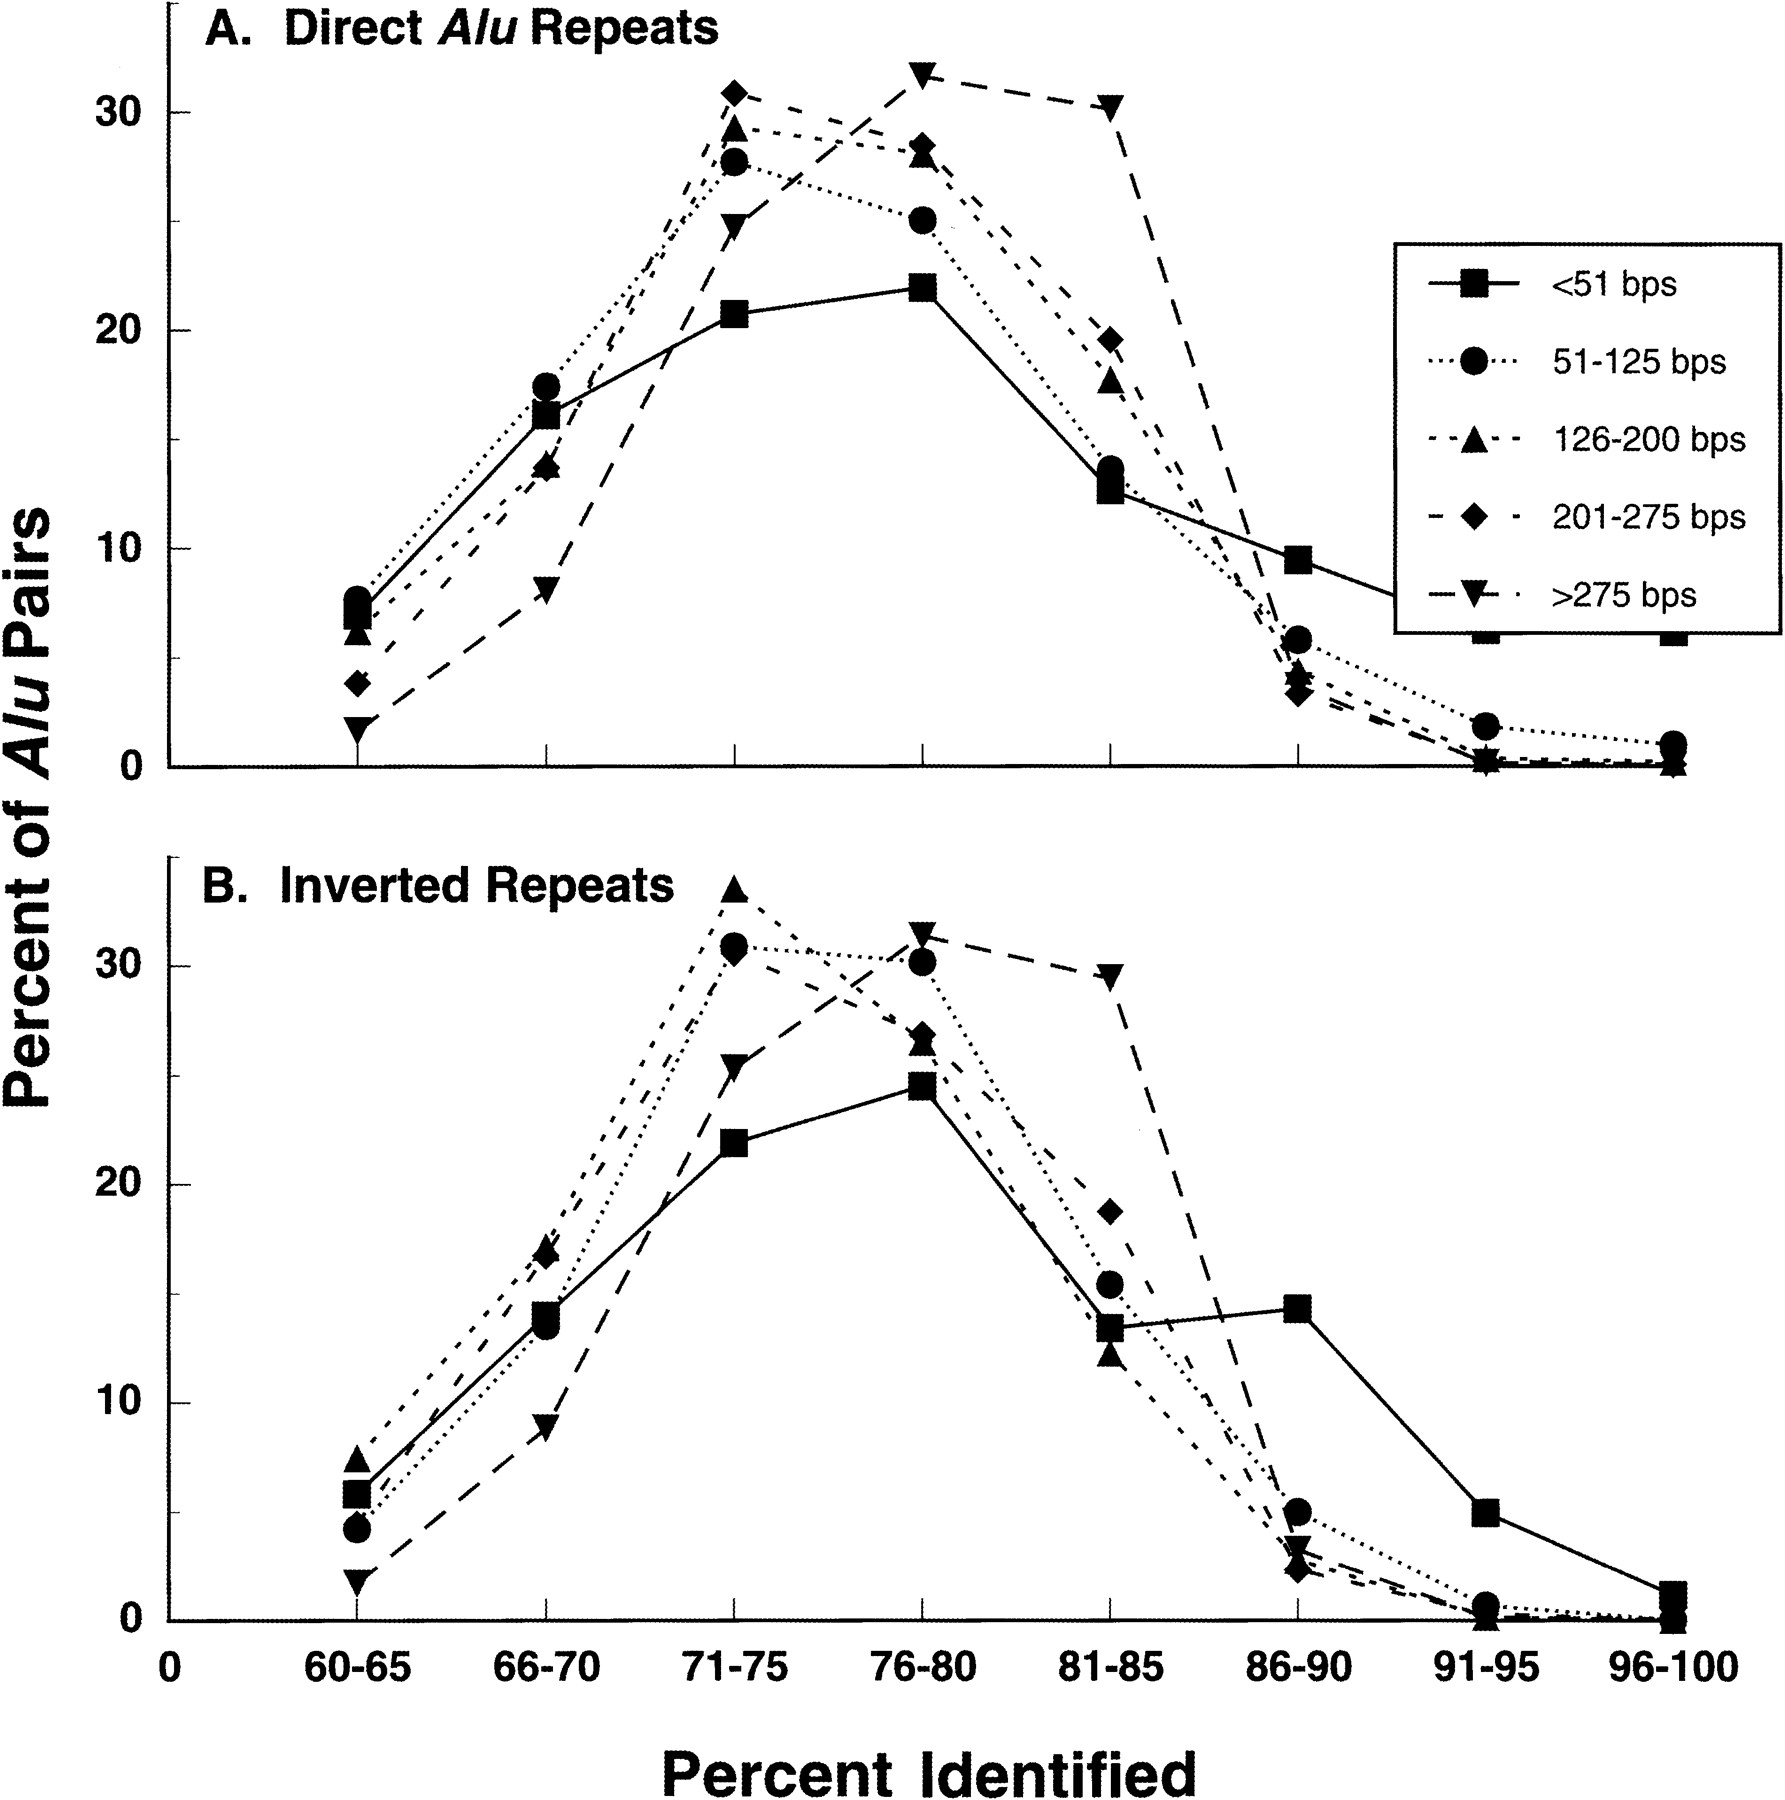
Figure 7.
The frequency of Alu pairs with different levels of homology in their aligned regions. Presented is the distribution of direct (A) and inverted (B) Alu pairs sharing different lengths of alignment in relation to the extent of homology. The data are derived from all the Alu pairs shown in Figure 1.


