
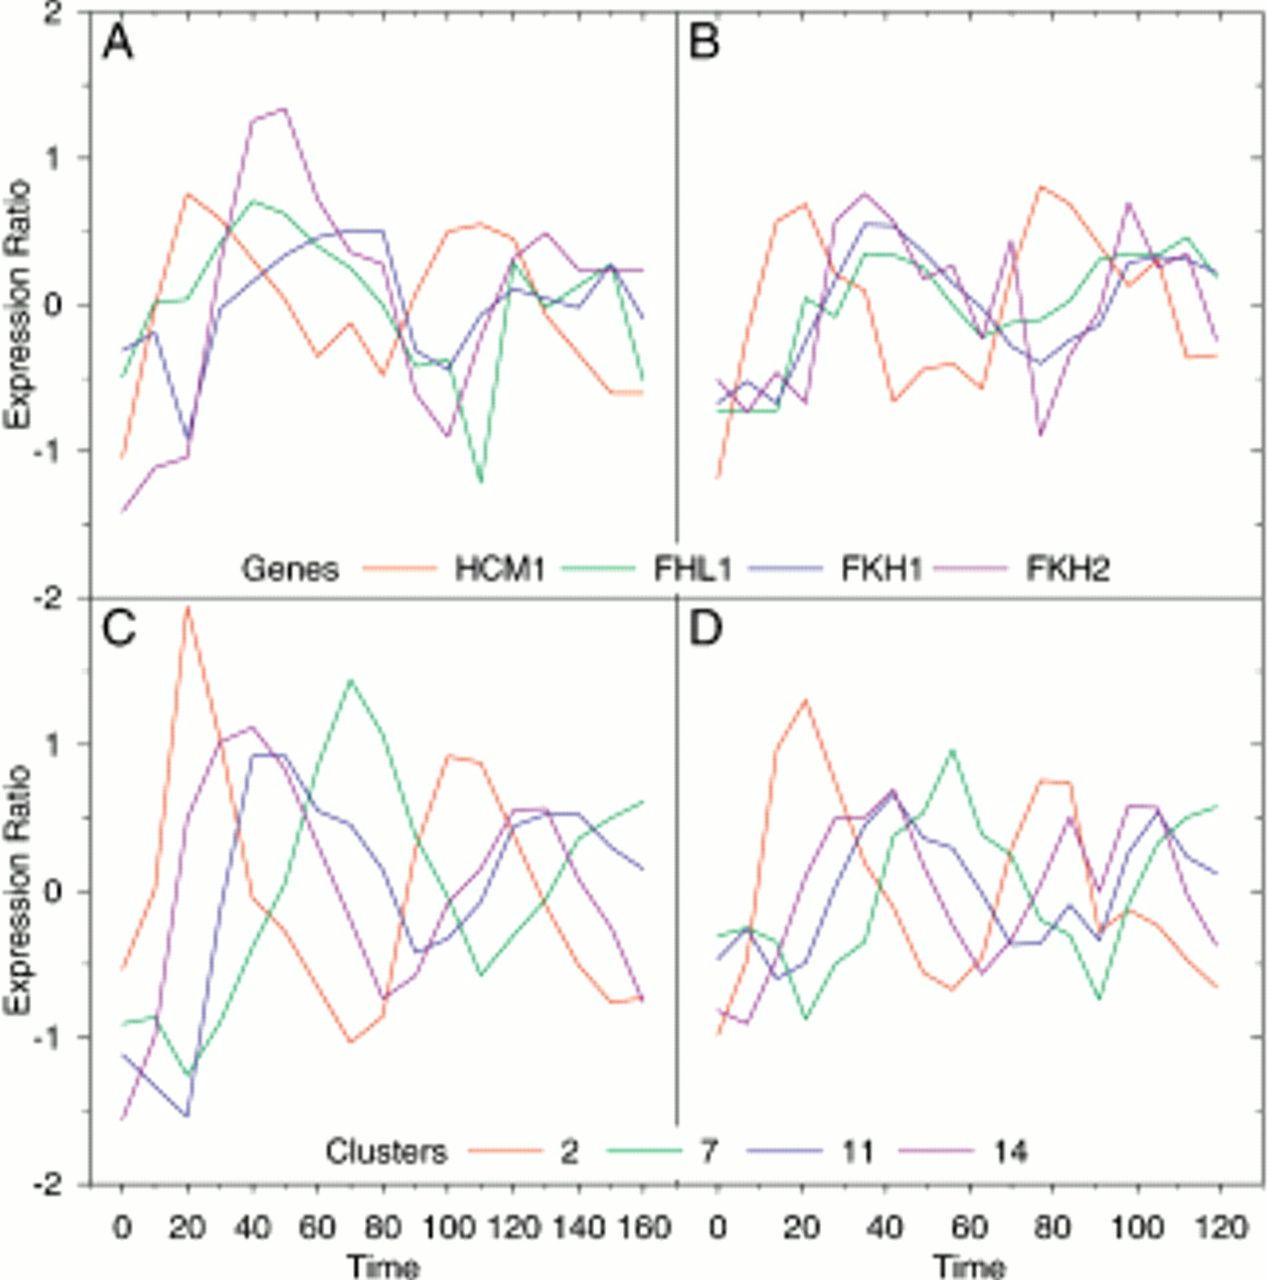
Figure 5.
Expression profiles of the yeast forkhead genes, HCM1, FHL1, FKH1, and FKH2, in the cdc28 synchronized (A) and α-factor synchronized (B) experiments and the mean expression profiles of clusters 2, 7, 11, and 14 in the cdc28 (C) and α-factor (D) synchronized experiments. The data were taken from the website of Spellman et al. (1998).


