
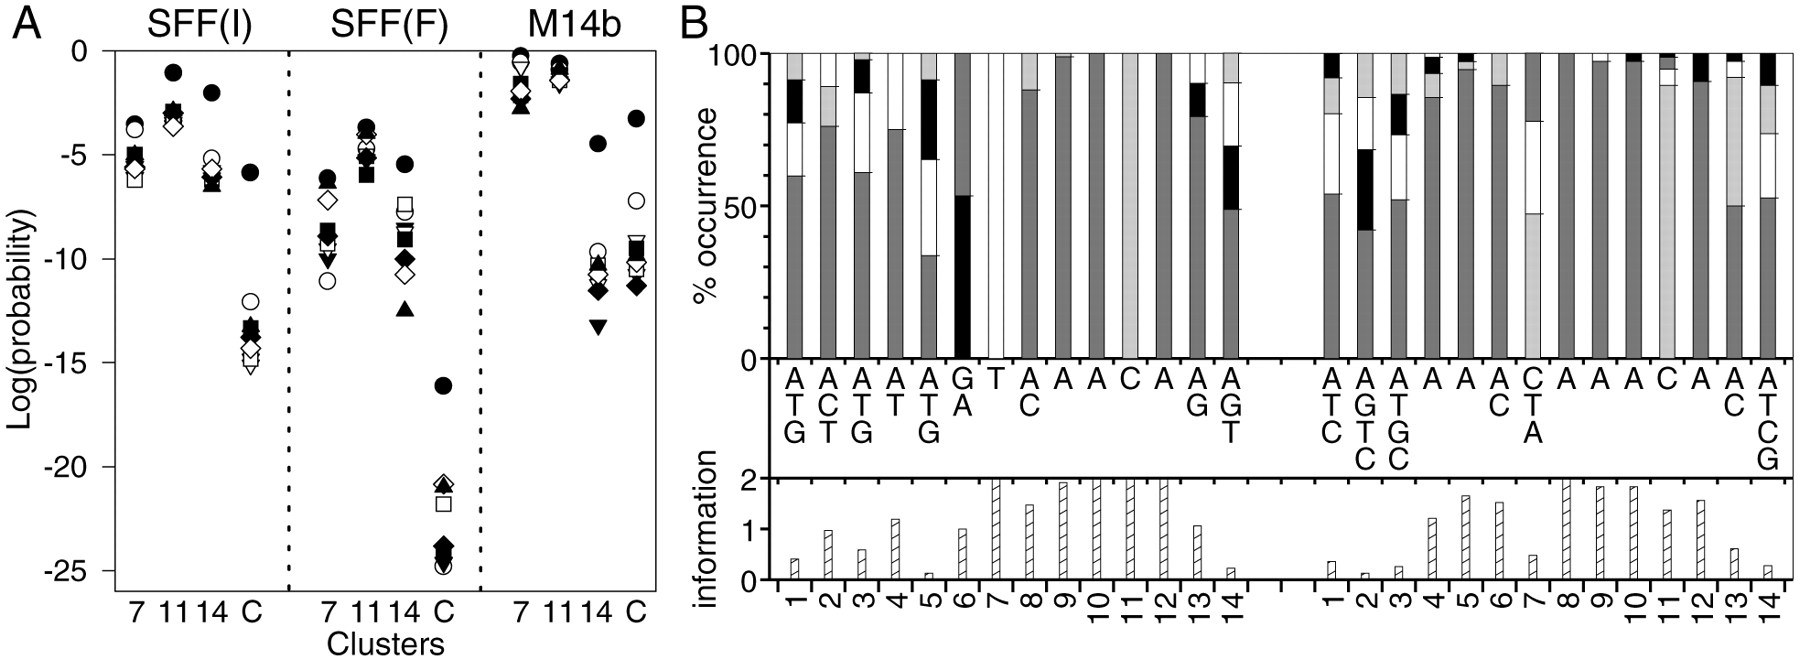
Figure 4.
(A) Probability plot of observing at least the numbers of genes from a sample of genes with upstream regions that match the initial (SFF-I) and final (SFF-F) SFF-like motifs and the M14b motif in clusters 7, 11, and 14 and the combination of the three clusters. The sample size symbols are as in Fig. 1. (B) The SFF-F motif (left, from 92 sequences) and the M14b motif (right, from 76 sequences) in the format described in Fig.3. The M14b motif is taken from the same strand as the SFF-F motif.


