
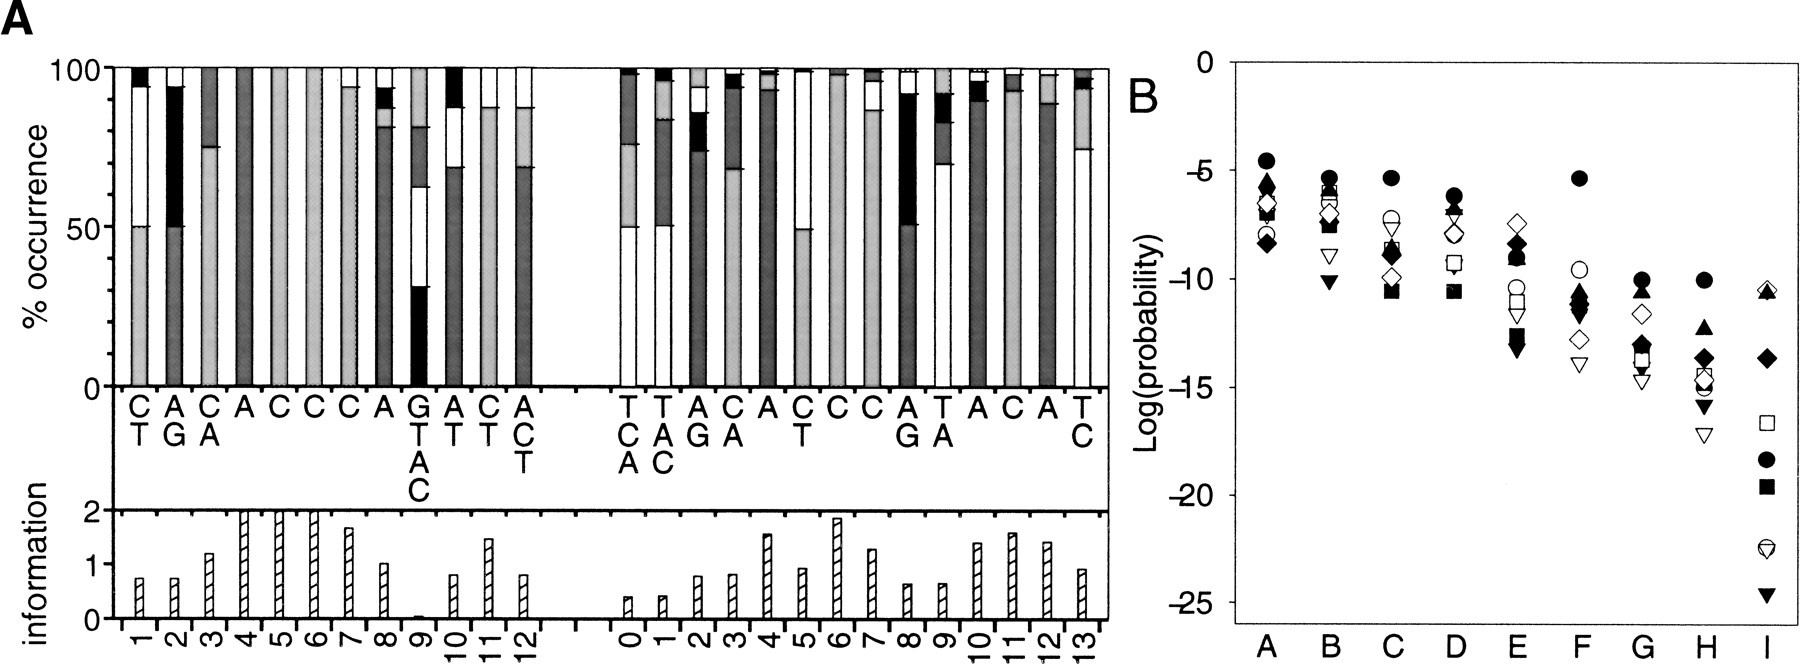
(A) Description of two versions of the Rap1 motif using the method of Smith and Xue (1998). The SCPD (Zhu and Zhang 1999; from 16 sequences) and Lascaris et al. (1999; from 129 sequences) versions of the motif are on the left and right, respectively. The top histograms show the frequency of the nucleotides (as percentages) at each position (T, white; C, light gray; A, dark gray; G, black). The nucleotides which occur in at least 10% of sequences are listed from most (top) to least frequent in the middle section, and the information content (Shannon 1948; Schneider and Stephens 1990) to a maximum of two bits at the position is given in the lower histograms. Information = log2(4) + Σ(f i × log2[f i]), where the sum is over the four nucleotides and f i (≠0) is the frequency of the ith nucleotide. Equivalent motif positions are numbered the same, so the two extra positions in the Lascaris motif are numbered 0 and 13. (B) Evaluation of the alterations to the SCPD motif to make it more like the Lascaris motif. In the plot the columns give the log of the probabilities of observing at least the number of genes from a sample in cluster 1 for: the SCPD matrix (A); changes at position 4 (B); position 7 (C); position 8 (D); positions 4 + 7 (E); positions 7 + 8 (F); positions 4 + 7 + 8 (G); positions 4 + 7 + 8 + 11 + 12 (H); and the Lascaris motif (I). The sample size symbols are as in Fig. 1.


