
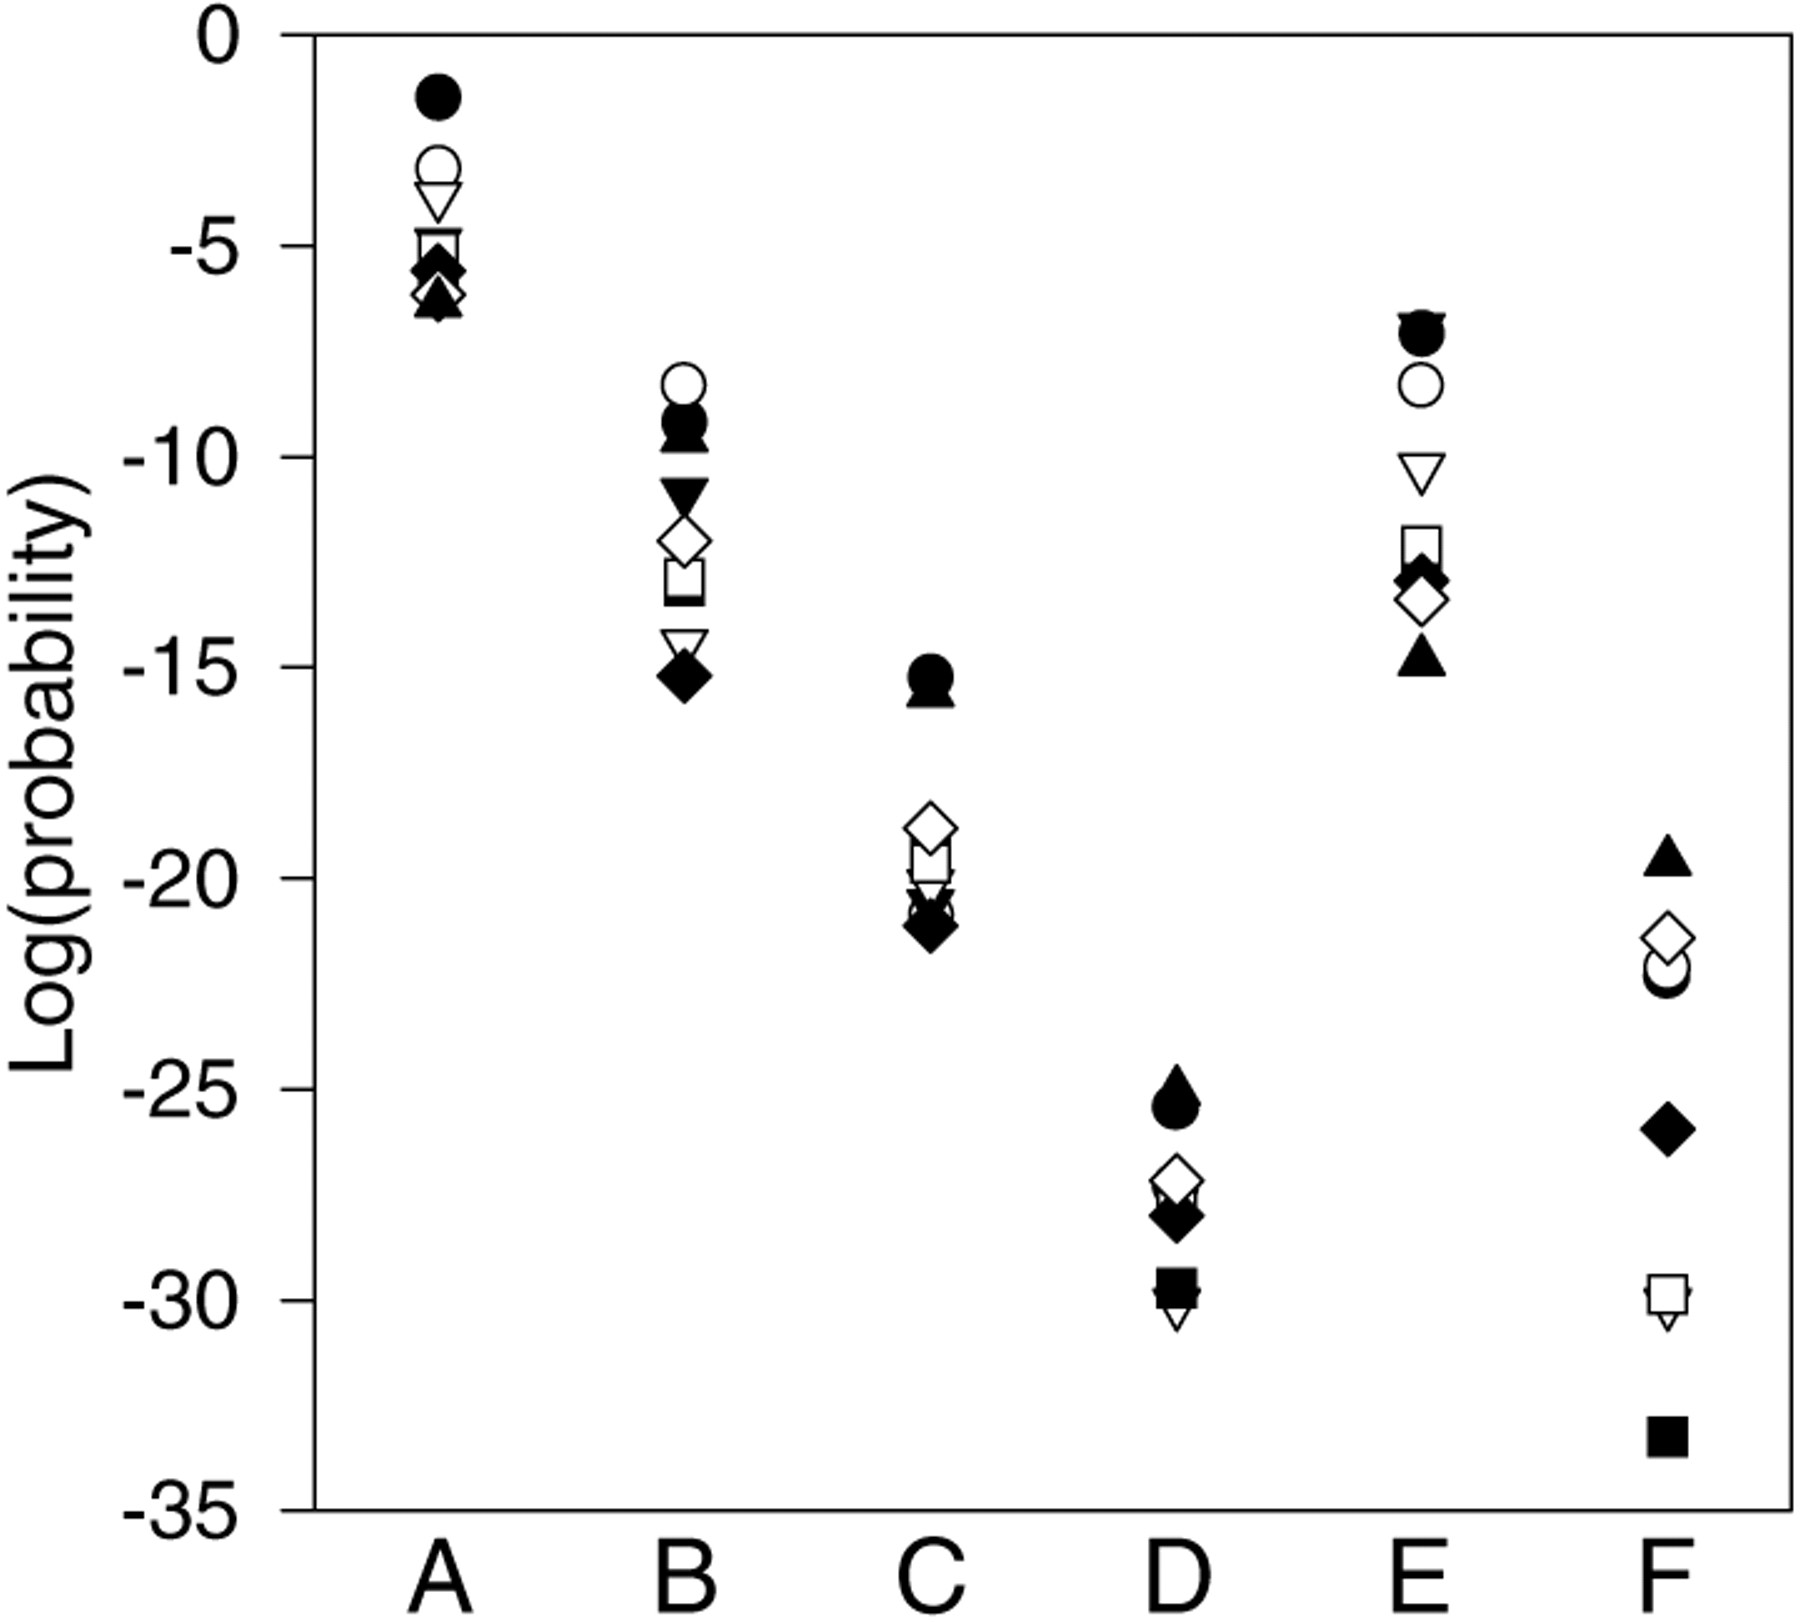
Figure 2.
Refinement of the MCM1 motif from the matches to it in cluster 7. The log of the probability of observing at least the number of matches to the original MCM1 motif from the SCPD (Zhu and Zhang 1999) is in column A. The other columns are the secondary MCM1 motif after the first refinement (B), the short (C) and long (D) motifs made from the best matches to the first refined motif, and two ECB motifs, one from the SCPD (E) and the other from Tavazoie et al. (1999; F). The sample size symbols are as in Fig. 1.


