
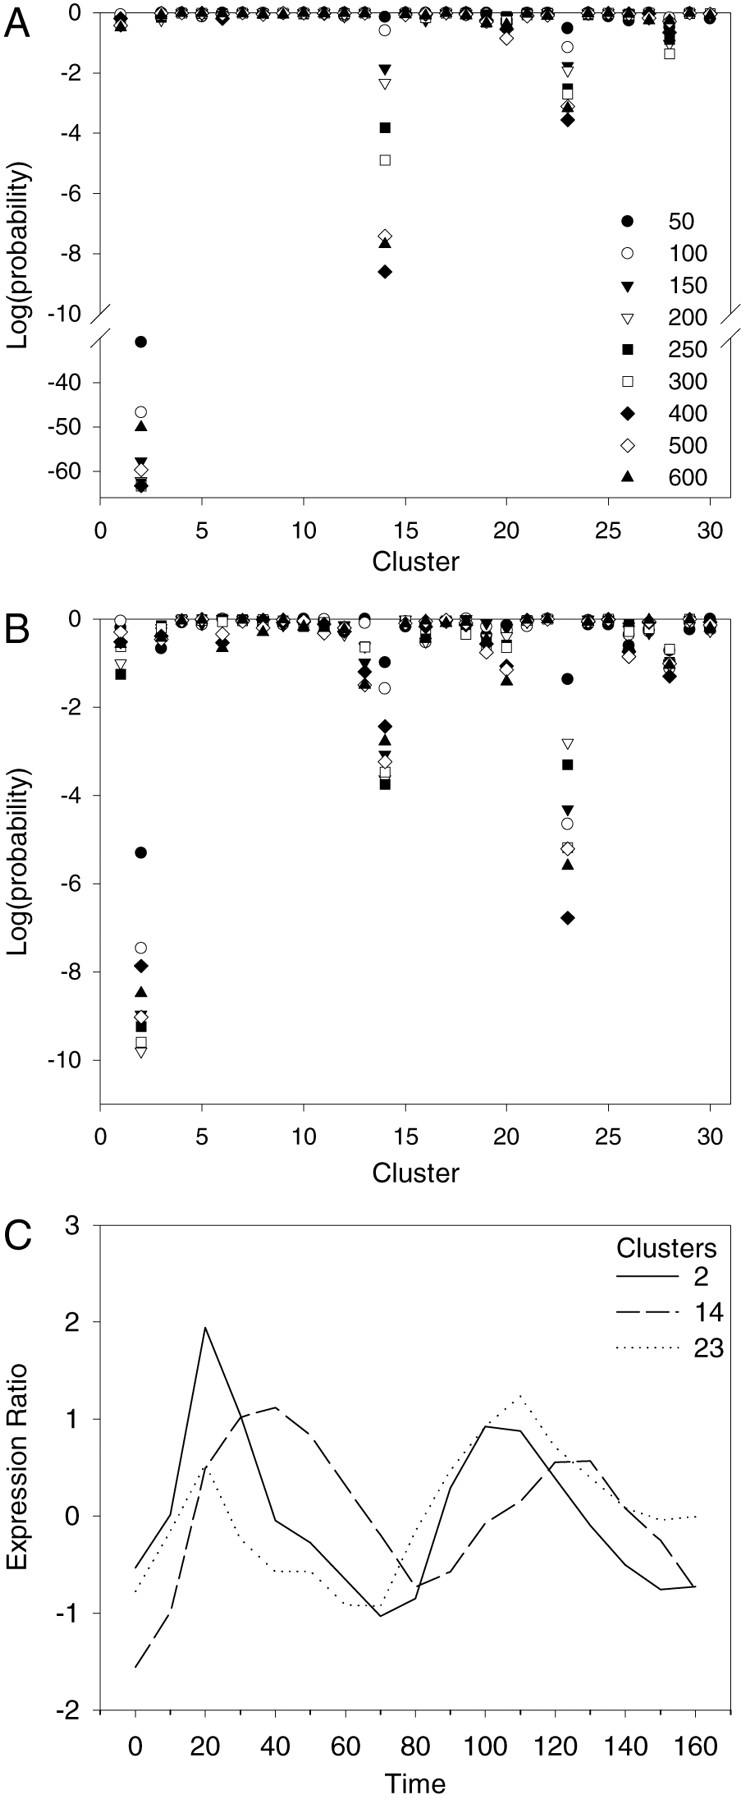
Analysis of genes with upstream regions that match the MCB motif in the primary (A) and secondary (B) cluster sets. The symbols representing the nine sizes of the samples of genes with the best matches of a motif to their upstream regions are given inA. These symbols are used throughout this work. In Aand B, the log of the probability of observing at least the number of genes from a sample in a cluster is given for each sample size and each cluster. Probabilities are determined from the hypergeometric distribution based on the total number of genes in the cluster set, the sample size, the size of the cluster, and the number of genes from the sample that are in the cluster (see Methods). The overrepresentation of genes from the samples in clusters 2, 14, and 23 in both cluster sets is clear. (C) The mean expression profiles for clusters 2, 14, and 23 (from data taken from the website of Spellman et al. 1998).


