
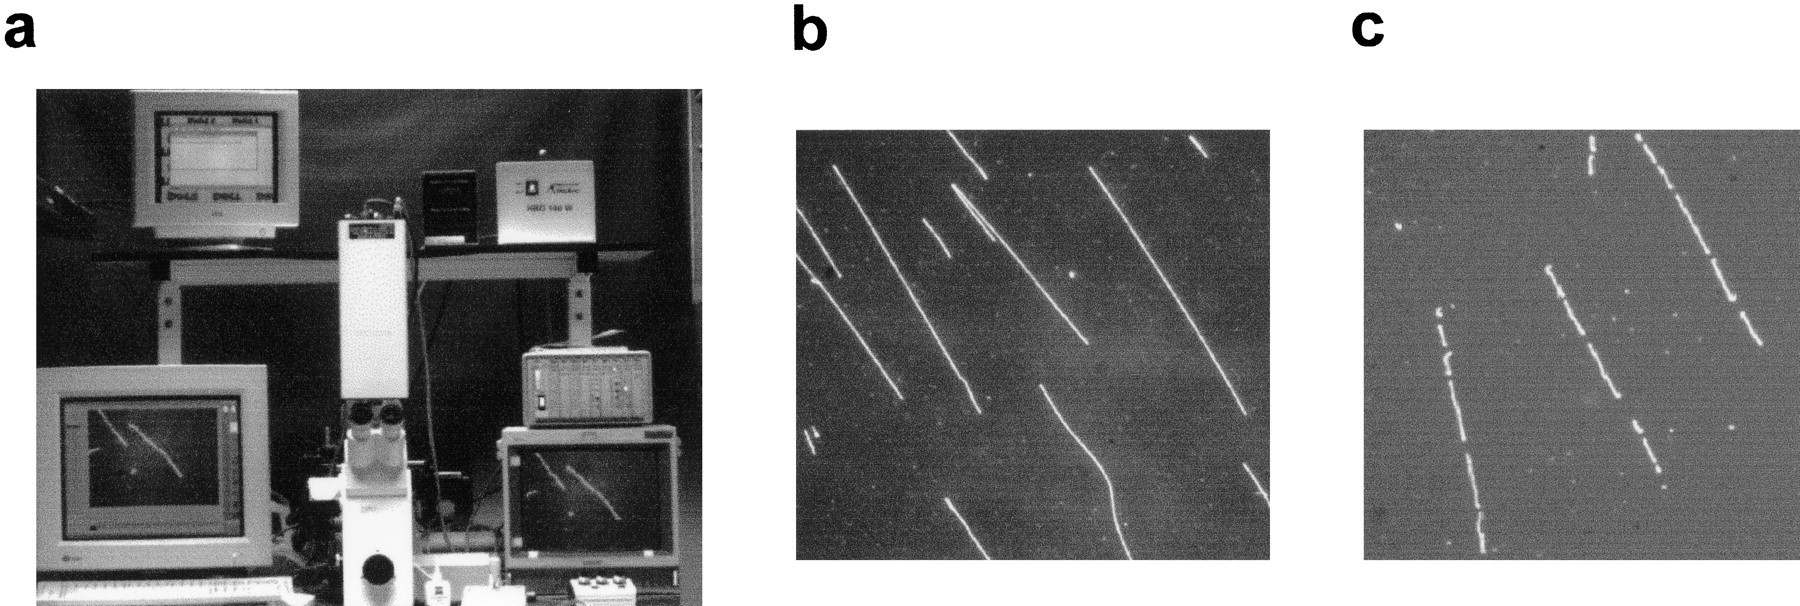
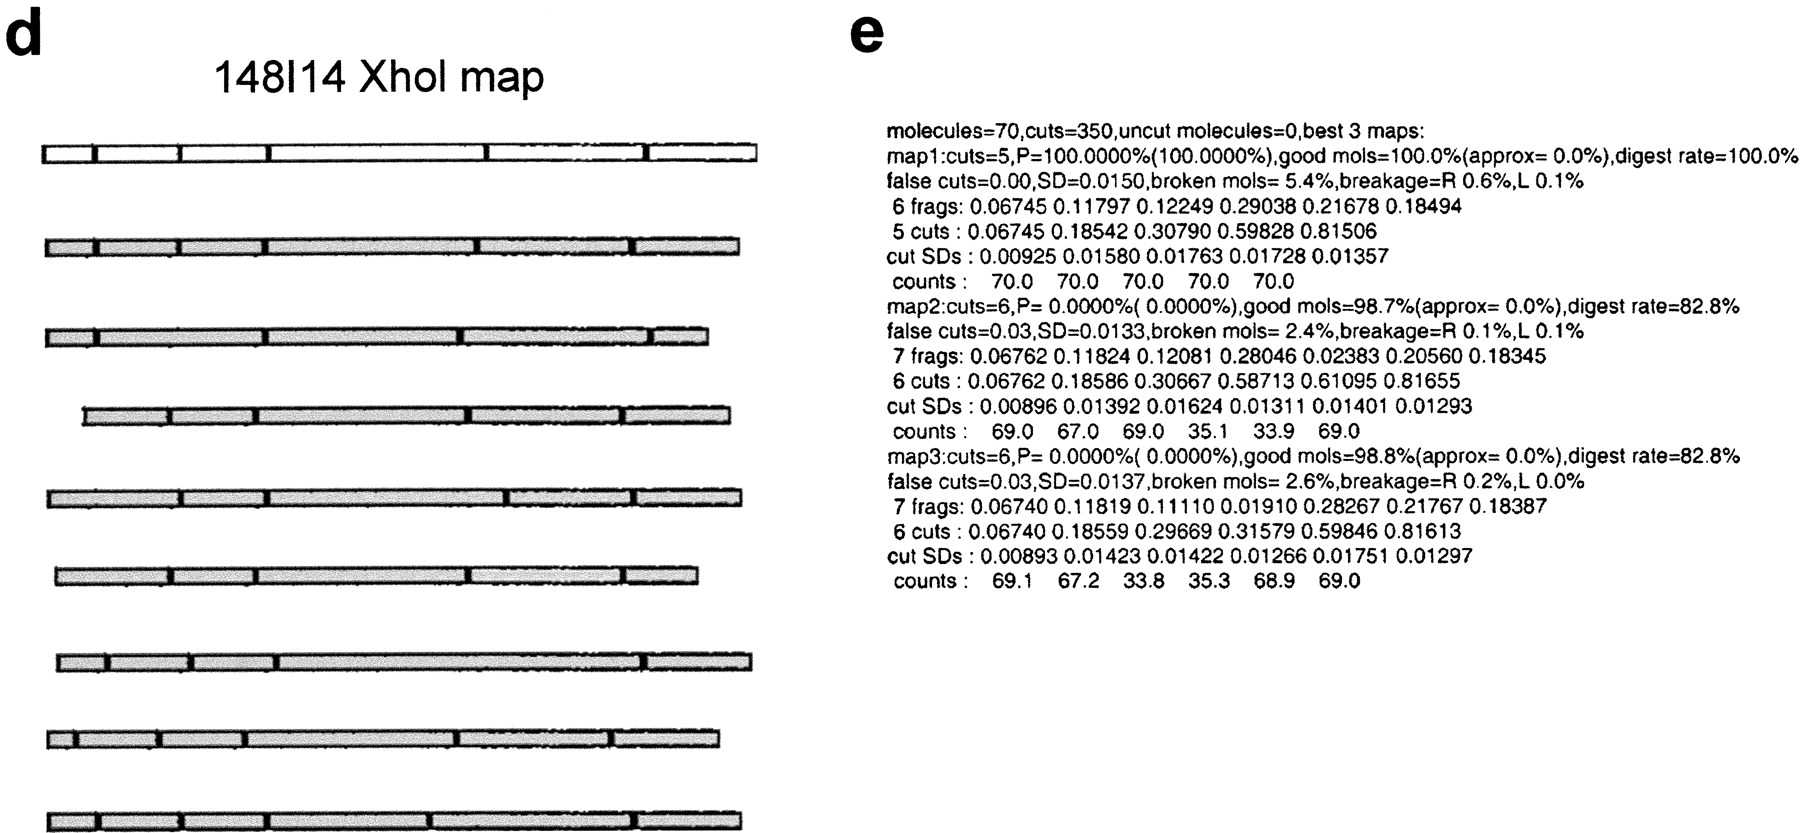
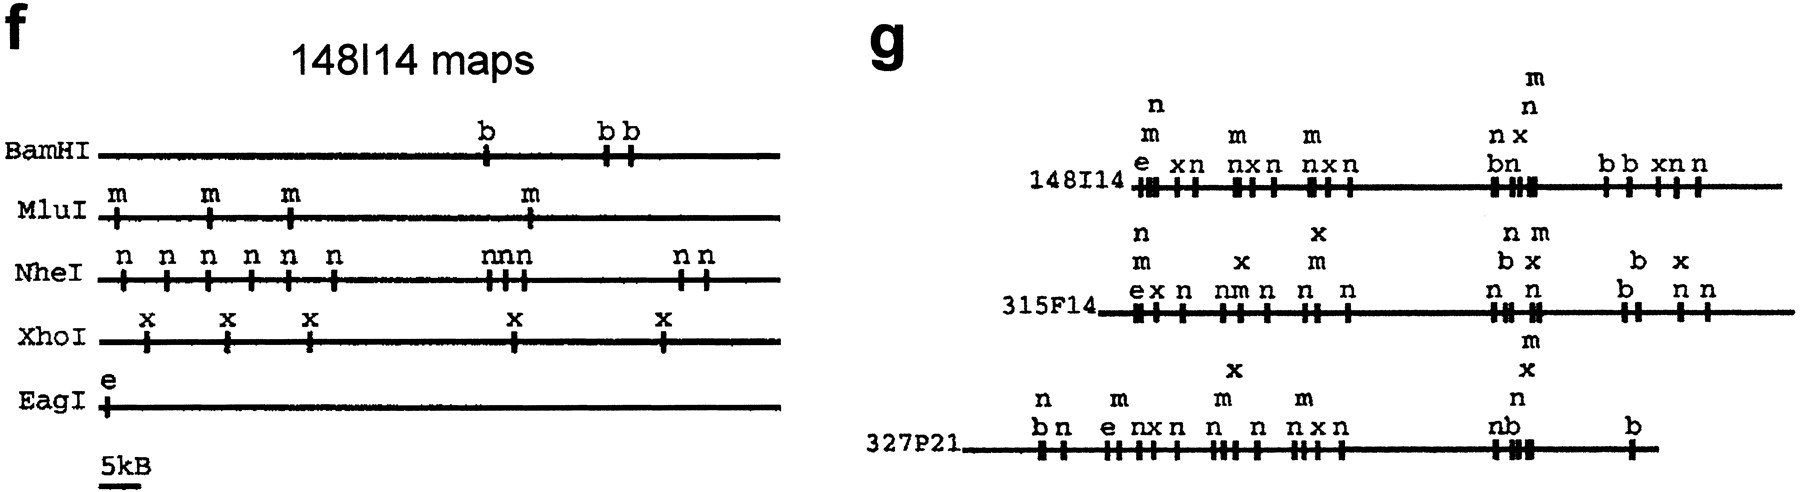
Overview of optical mapping system. (a) Optical mapping station for image collection, including a Zeiss 135M Axiovert microscope, SIT camera, and Sony monitor for viewing slides and CCD camera (attached underneath microscope), Ludl controller, and Dell and Sun computers for image collection. (b) Uncut BAC DNA deposited on optical mapping surface. (c) BAC DNA (clone 148I14) digested on optical mapping surface with restriction enzymeXhoI. (d) Illustration demonstrating construction of highest probability single-enzyme (XhoI) map (white background) from individual input molecules (gray background) of clone 148I14. (e) Output of automatic map-making program indicating the three most probable XhoI maps of clone 148I14. Statistics provided by the map-making program include the number of molecules used to construct the map, the probability (P) of each map, the percentage of molecules that fit the map (good mols), the fraction of cuts that are false cuts, and the percentage of molecules that show breakage at either the right or left ends (breakage R or L). (f) Single-enzyme maps of clone 148I14. In general, the map with the highest probability is chosen as the final map. (g) Composite map of clone 148I14 is constructed by overlaying the single-enzyme maps after the orientation of single-enzyme maps has been determined. GENTIG then attempts to create a contig of this clone with any other overlapping clones (315F14 and 327P21).


