
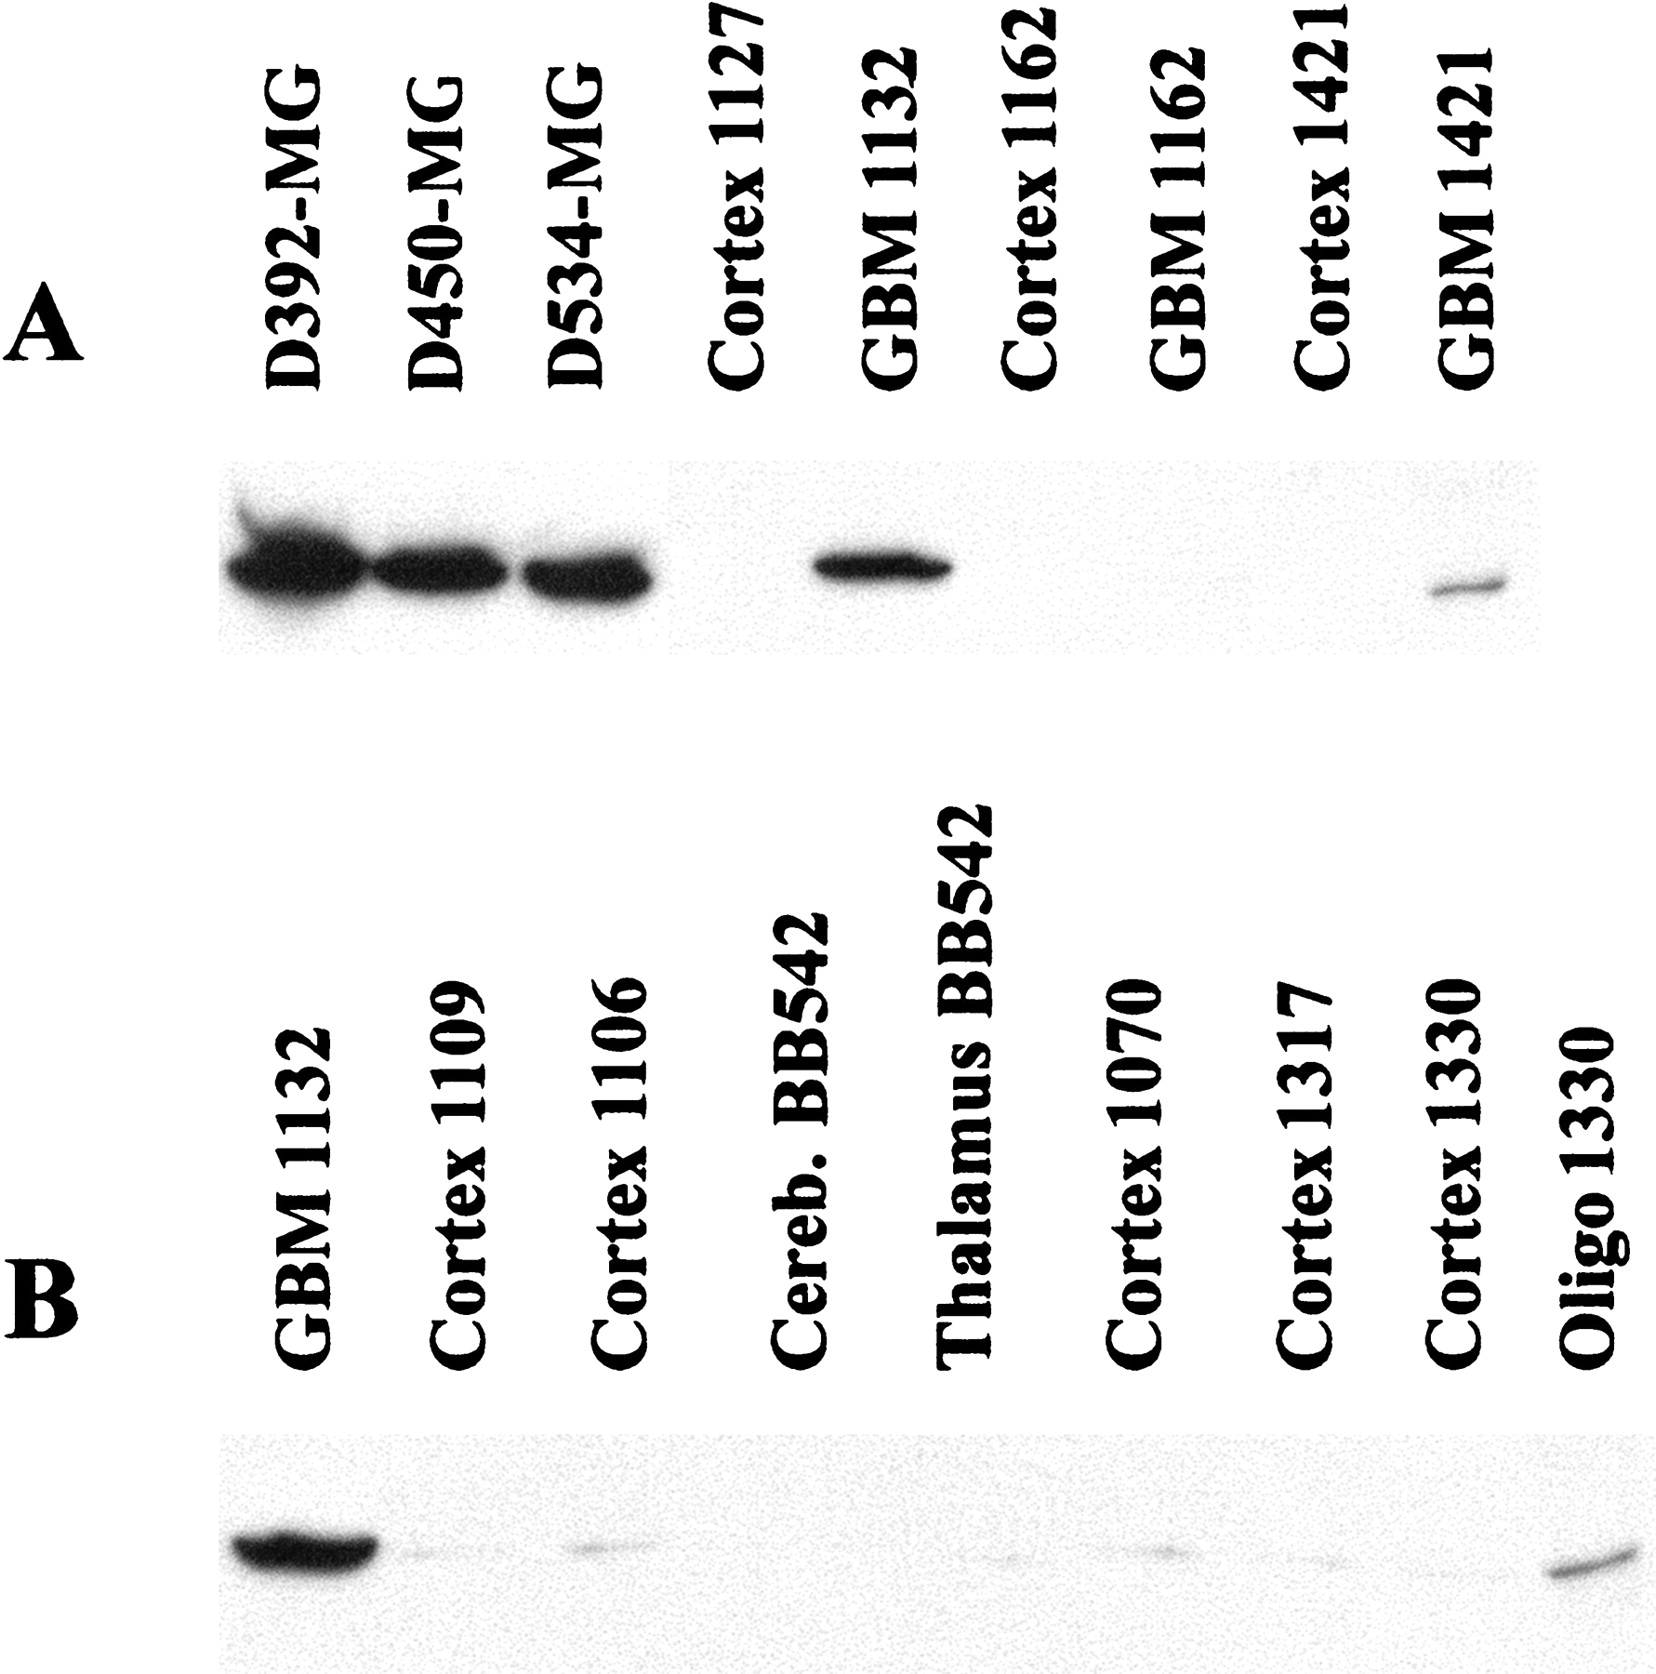
Figure 4.
Western blotting of annexin A1. Protein levels from brain tumors, glioblastoma cell lines, and normal neural tissue were compared. (A) Bands in both glioblastoma cell lines (D392-MG, D450-MG, and D534-MG) and primary GBM indicate that protein is expressed in transformed, but not normal (Cortex 1127, Cortex 1162, and Cortex 1421) tissues. (B) Normal tissues from different normal brain regions did not express high levels of ANXA1 protein compared to a glioblastoma (GBM 1132) or an oligodendroglioma (Oligo 1330).


