
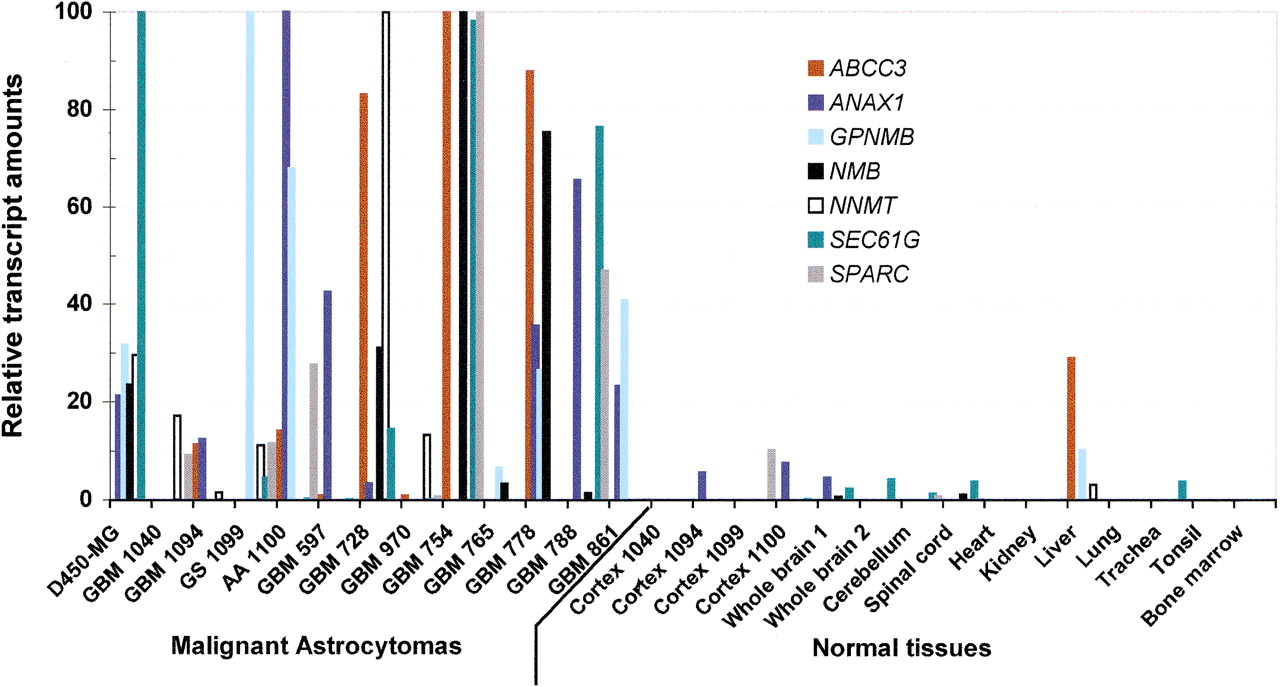
Figure 3.
Relative expression of the tumor markers in 12 high-grade astrocytomas, one glioblastoma cell line (D450-MG), and normal tissues. Glioblastoma (GBM), gliosarcoma (GS), anaplastic astrocytoma (AA), and cortex samples with the same patient number indicate matched normal/tumor pairs removed during the same surgery. Gene expression levels determined by fluorescent-PCR were plotted relative to the highest expression tumor in each case. Gene expression is graphically displayed relative to serial dilutions of the highest expressing tumor.


