
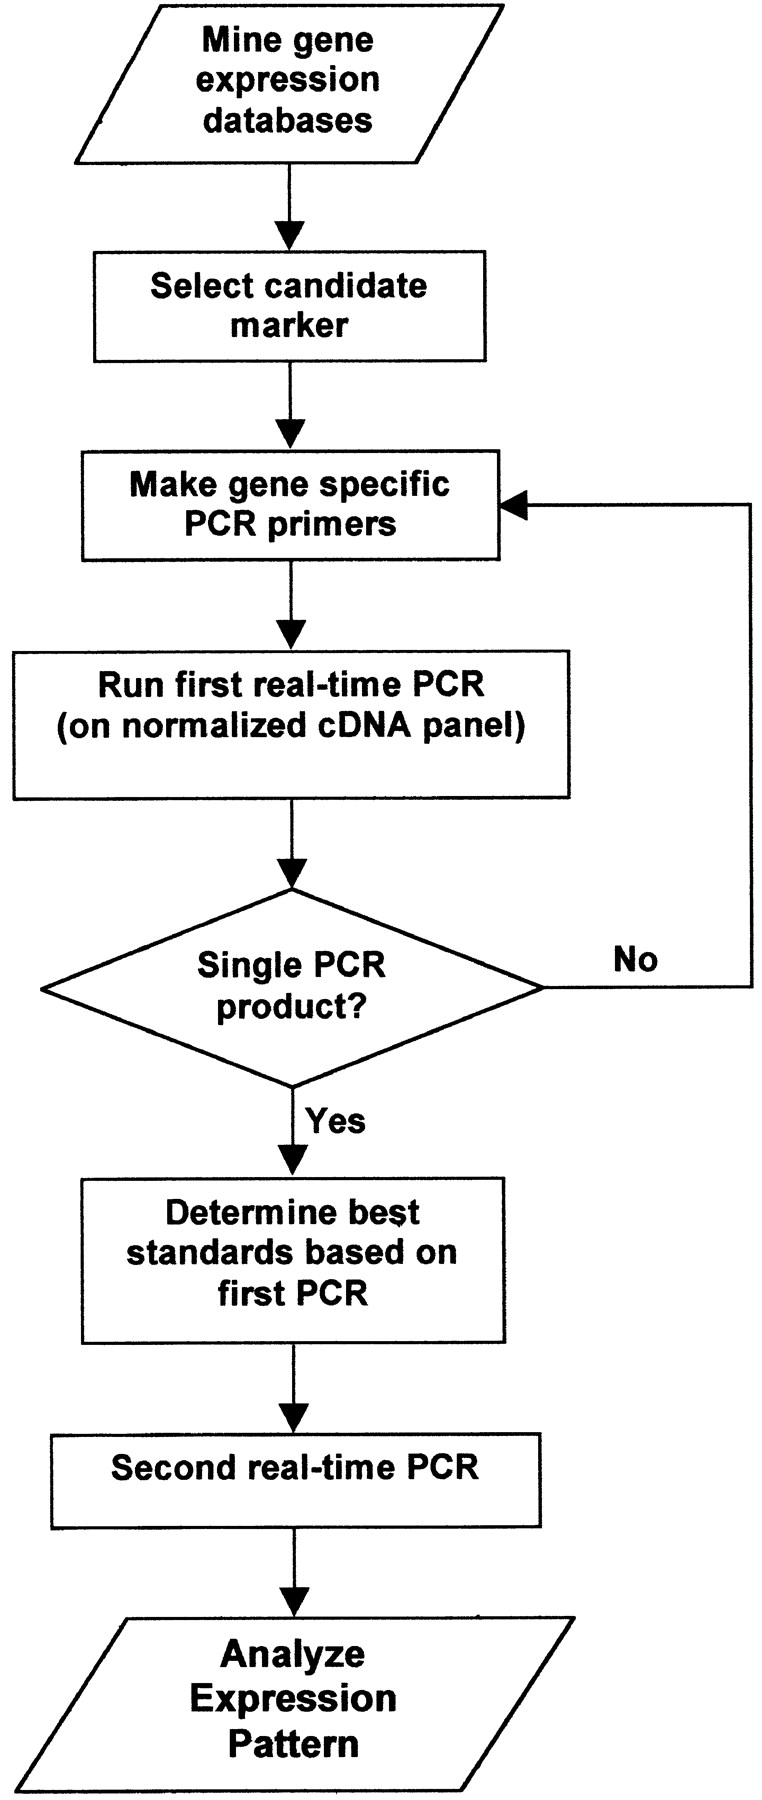
Figure 1.
Process for finding candidate tumor markers, using fluorescent-PCR expression comparison (F-PEC). Genes overexpressed in tumors are mined from gene-expression databases. A normalized cDNA panel is used to rapidly compare expression levels in malignant and normal tissues. The process requires an initial PCR to determine the specificity of the primers, the product melting temperature, and the expression range of the tested samples. The highest-expressing sample from the first PCR is serially diluted to create a standard curve for a second PCR, yielding information on the relative expression over several orders of magnitude.


