
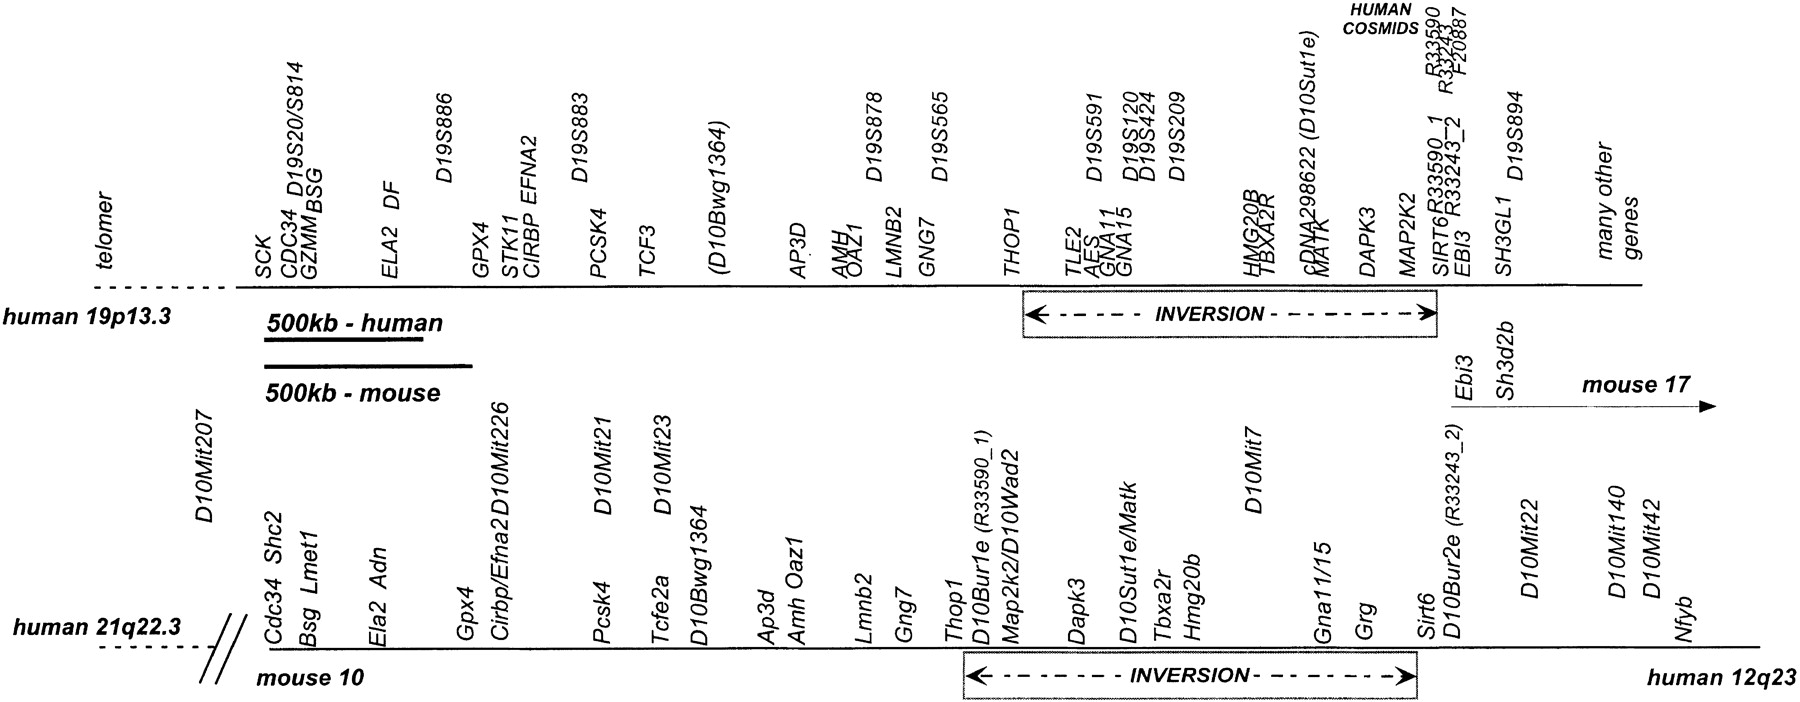
Physical map of 19p13.3 and mouse chromosome 10 identifies inversion and synteny breaks. Overall physical map constructed from the cosmid contiguous sequence (contig) restriction maps (19p13.3) and schematic constructions of the mouse chromosome 10 pulsed-field gel electrophoresis (PFGE) map. The map shows overall conserved order and distances of many genes for ∼2500 kb — ∼1800 kb in mouse—followed by a region of ∼1200 kb — ∼900 kb in mouse — which is inverted in the two species relative to each other. In most cases, the mouse and the human gene names are identical or nearly identical (see also Table 1). The mouse genetic markers (D10Mit …) were placed onto the map using genetic breakpoints and yeast artificial chromosomes (YACs). The mouse map overall is shorter than the human map. To better compare the gene order of the two maps, they were scaled proportionately, such that the maps are easily compared, but note that the size bars are different in size.


