
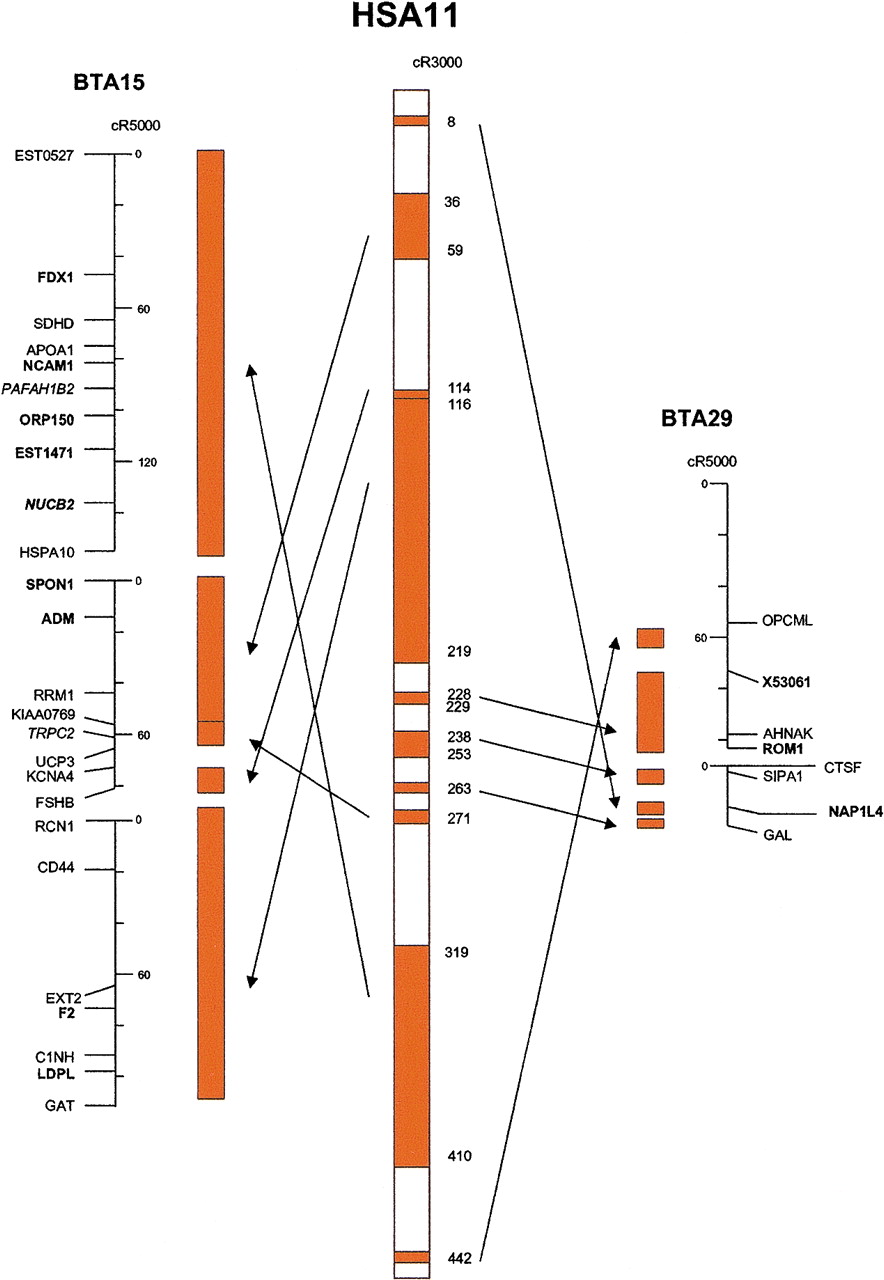
Figure 1.
Cattle-on-human comparative map of HSA11. Clear space between segments represents regions of the human genome for which no cattle orthologs have been mapped. Maps were simplified to show only comparatively mapped genes. Coverage of HSA11 on BTA15 and BTA29 is 41% (see text).


