
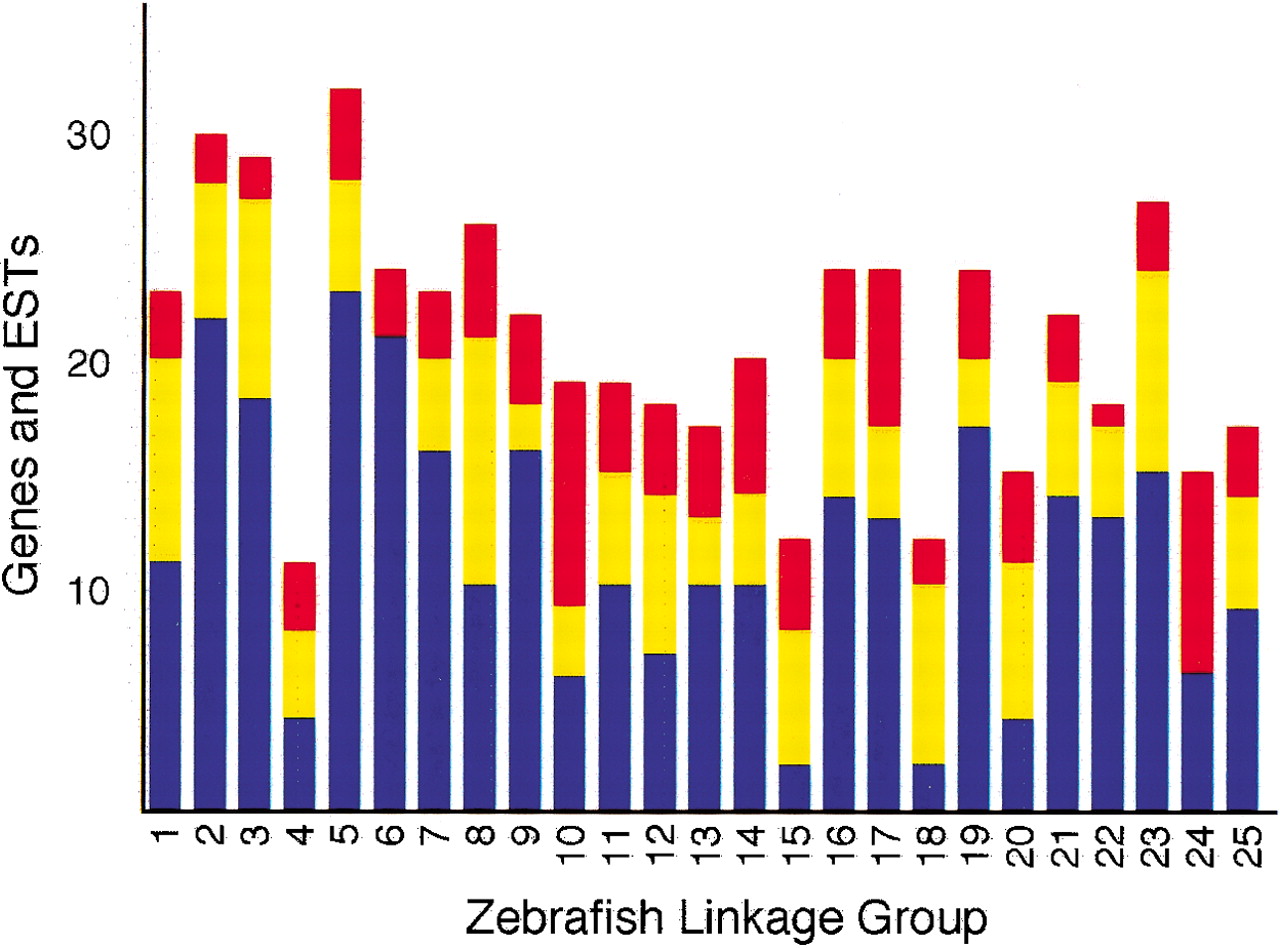
Distribution of genes and ESTs in synteny groups. Bars indicate the distribution of zebrafish genes and ESTs according to class of synteny relationship (Y-axis) for each linkage group (X-axis). Number of genes and ESTs from homology segments with two or more contiguous members where gene order is conserved between zebrafish and human are shown in blue. Additional genes and ESTs in conserved synteny groups but not in contiguous sets are shown in yellow. Genes and ESTs that are not part of conserved synteny groups (singletons) are depicted in red. Together these three classes account for all the mapped genes and ESTS with orthologs predicted unambiguously by WU-BLASTanalysis (see Methods).


