
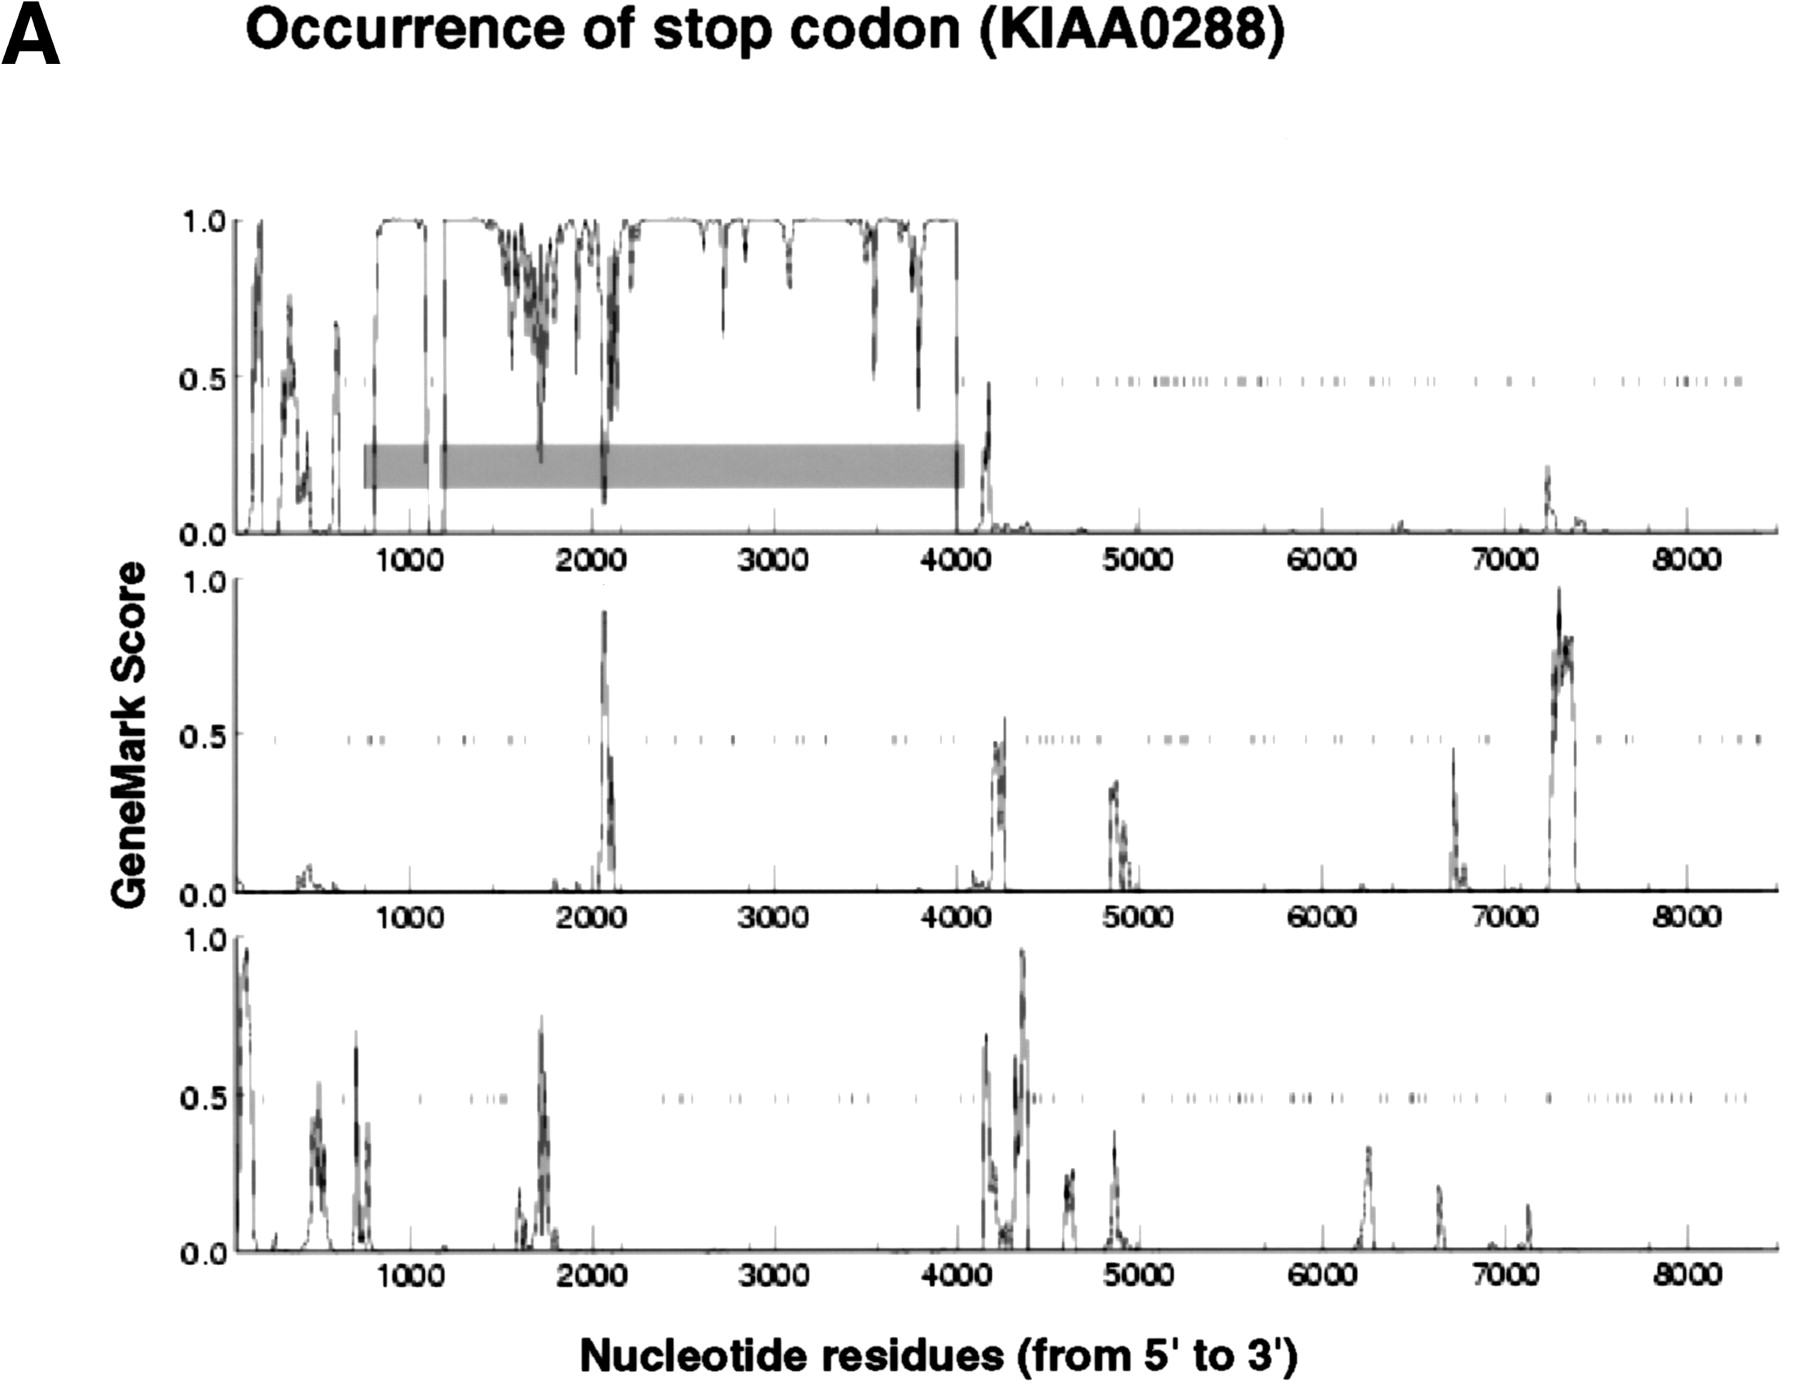
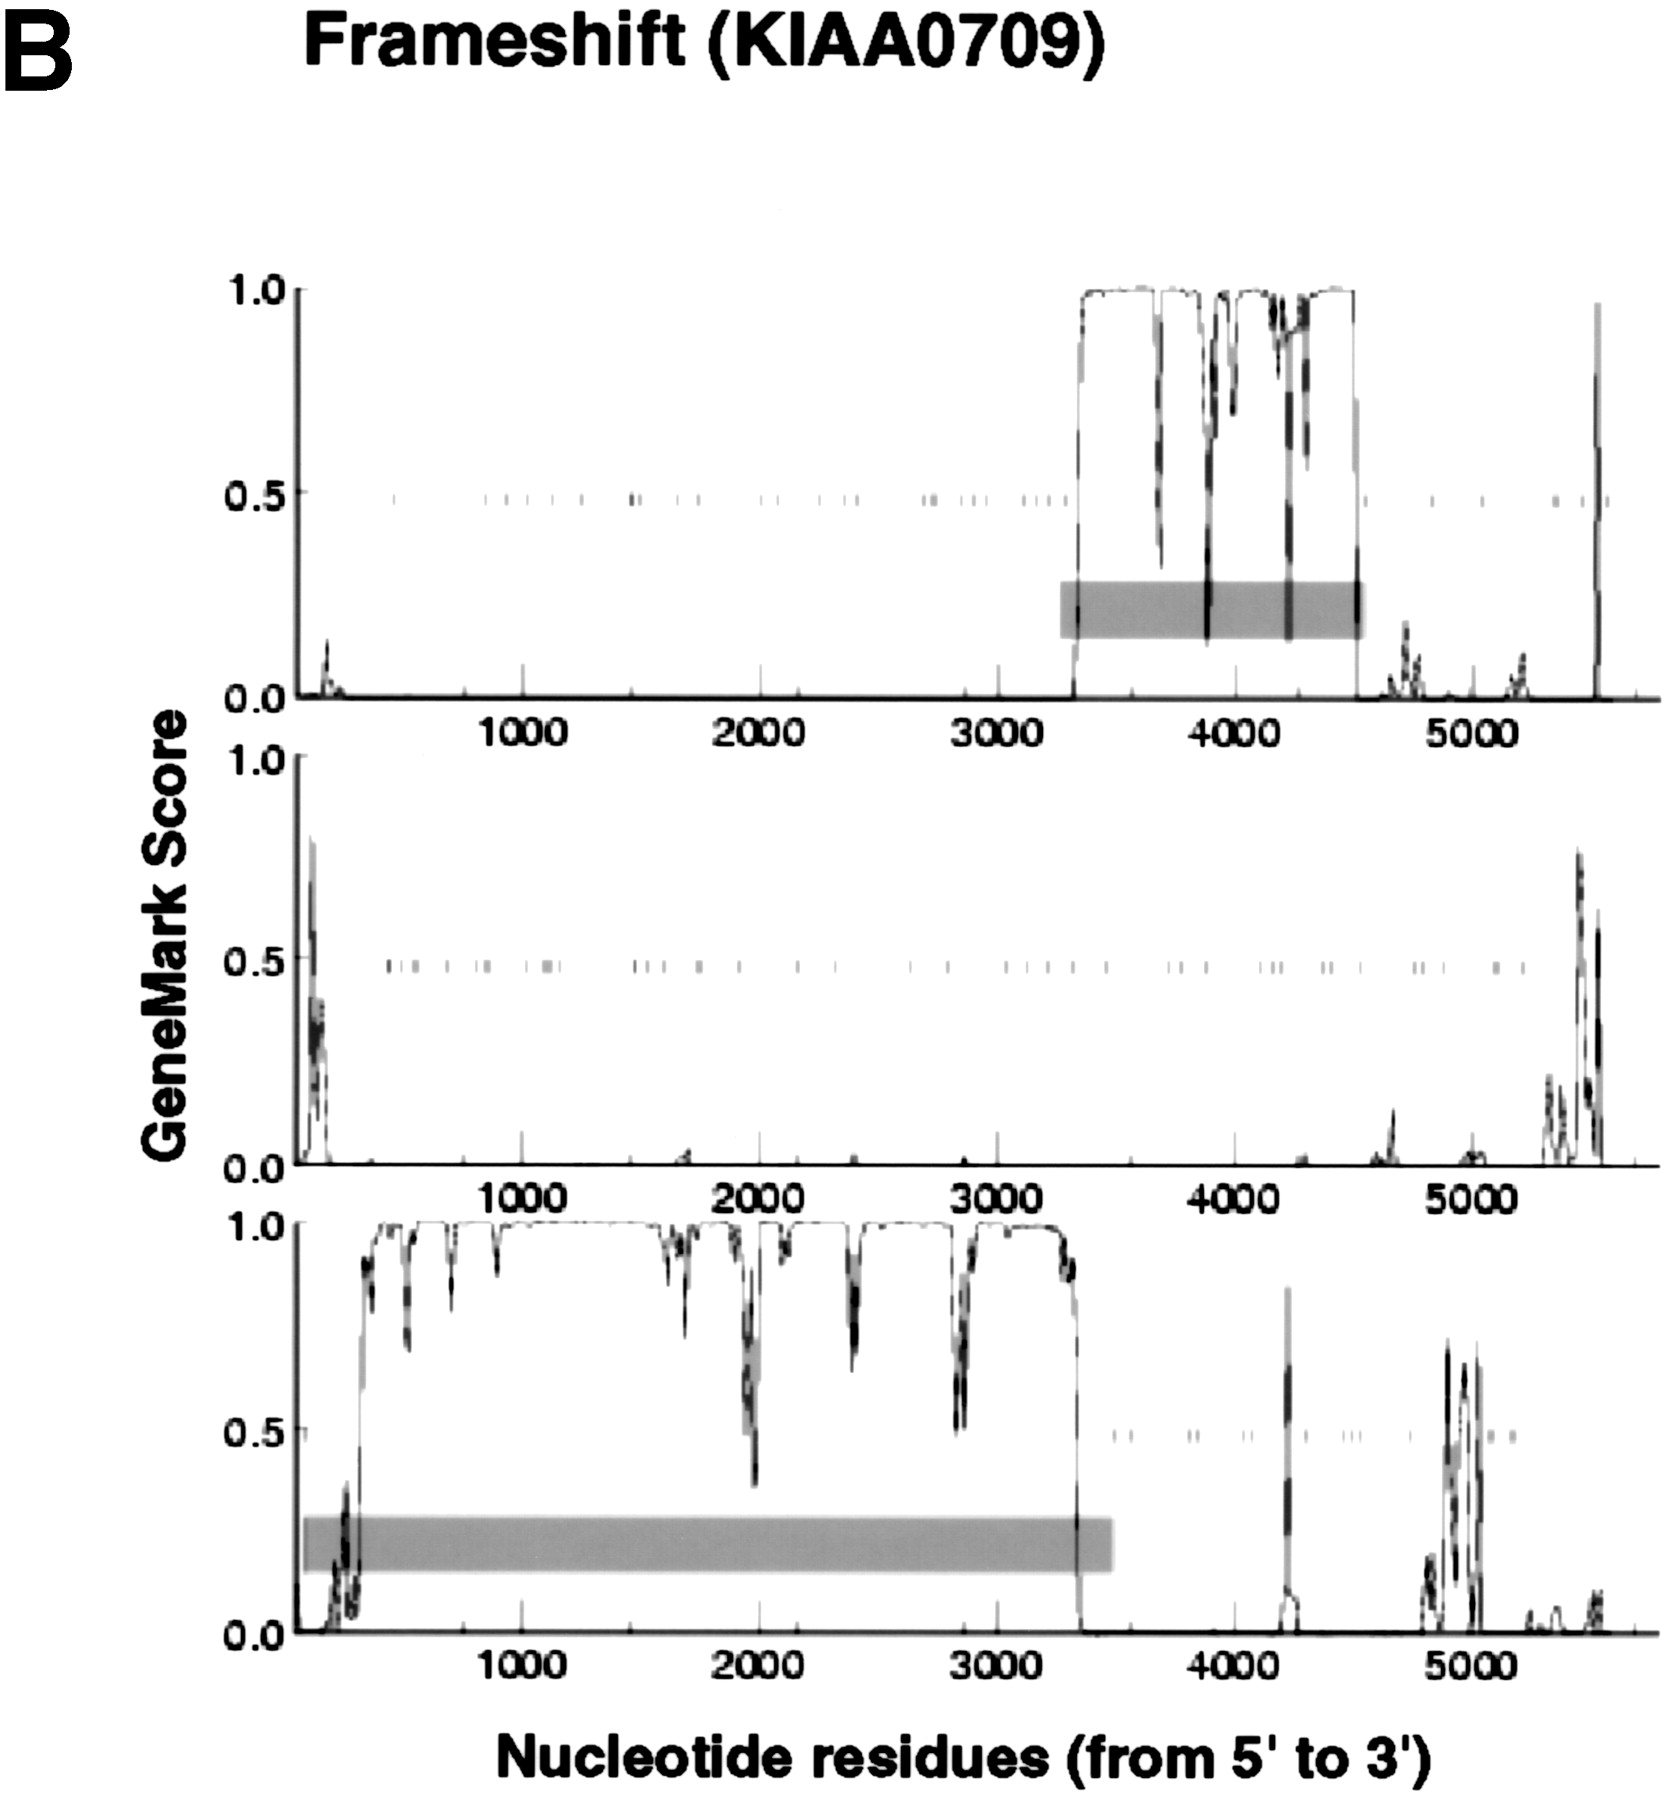

Figure 1.
GeneMark profiles of typical CDS interruption. GeneMark profiles were generated according to the previous report by Borodovsky et al (1994). Small vertical bars in each profile indicate the positions of termination codons, and the predicted CDSs are highlighted by horizontal gray bars. The GeneMark profiles for three reading frames only along the sense strand are shown here.


