
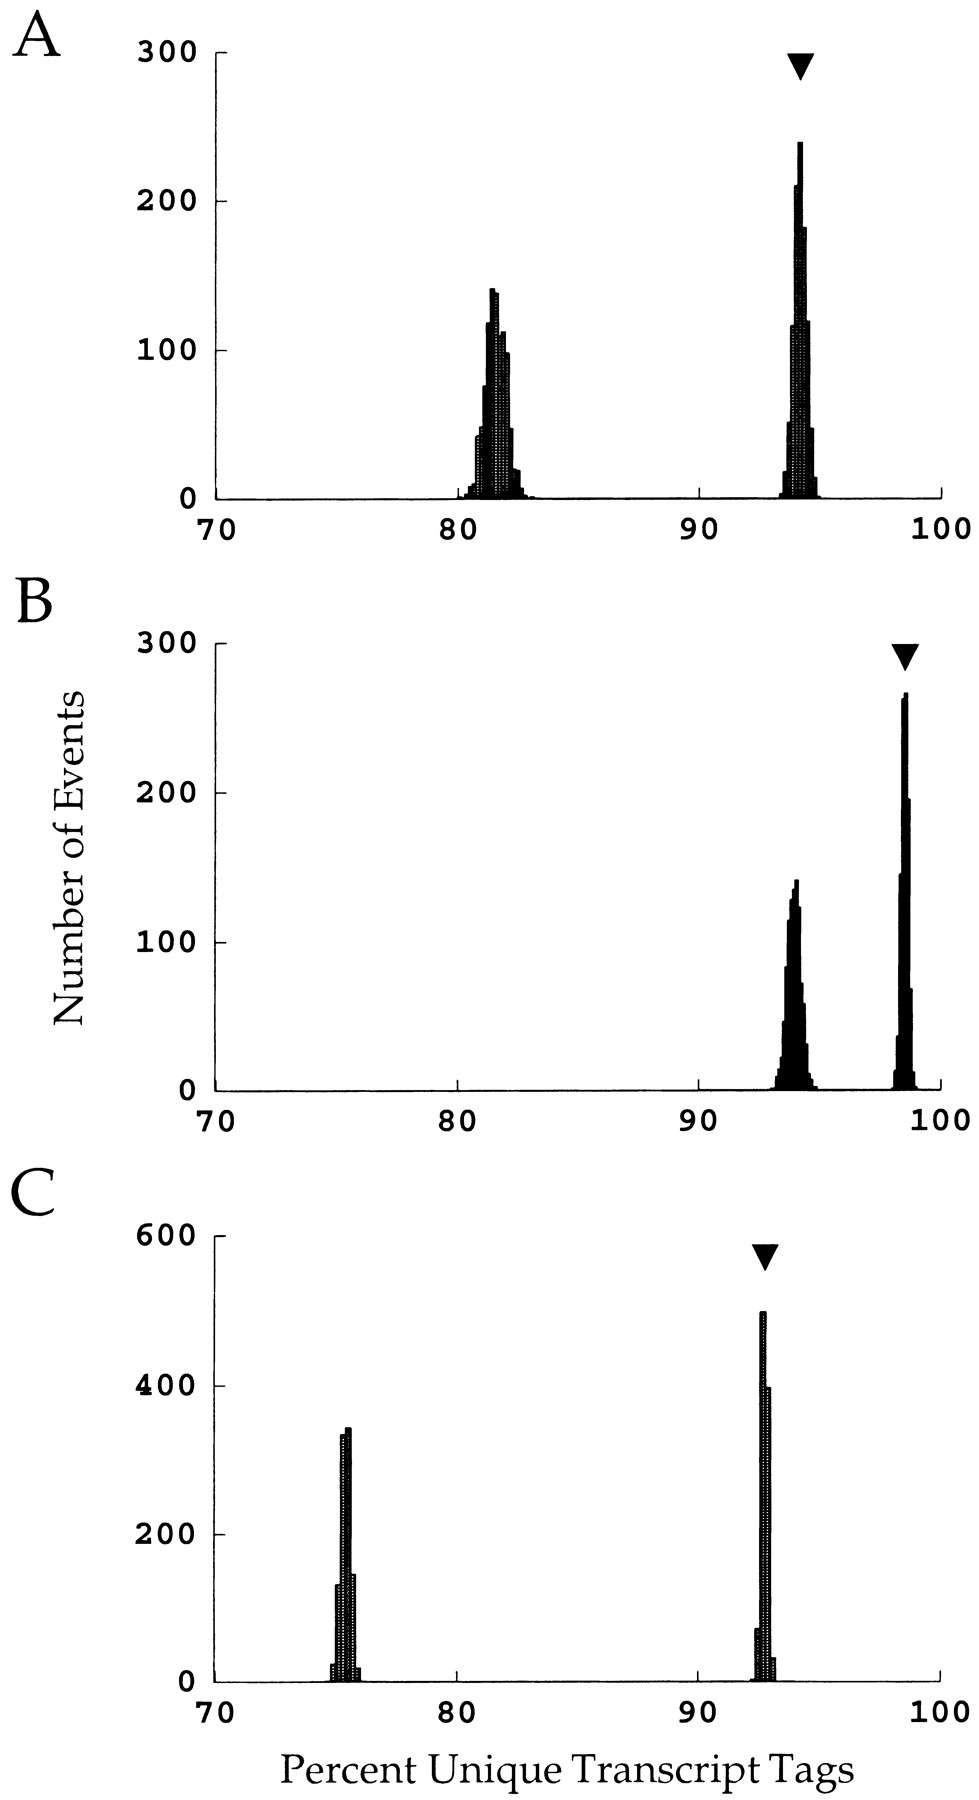
Figure 2.
The probabilities that a given gene will have a unique tag sequence under various conditions. In each plot, the right-most distribution arises from random DNA sequences, and the arrows indicate the expected outcome. The left-most distribution in each plot is the probability given nonrandom DNA sequences. (A) 9-base tags and 15,720 genes (the assumptions of Table 1A). (B) 10-base tags and 15,720 genes (the assumptions of Table 1B). (C) 10-base tags and 78,600 genes (the assumptions of Table 1C).


