
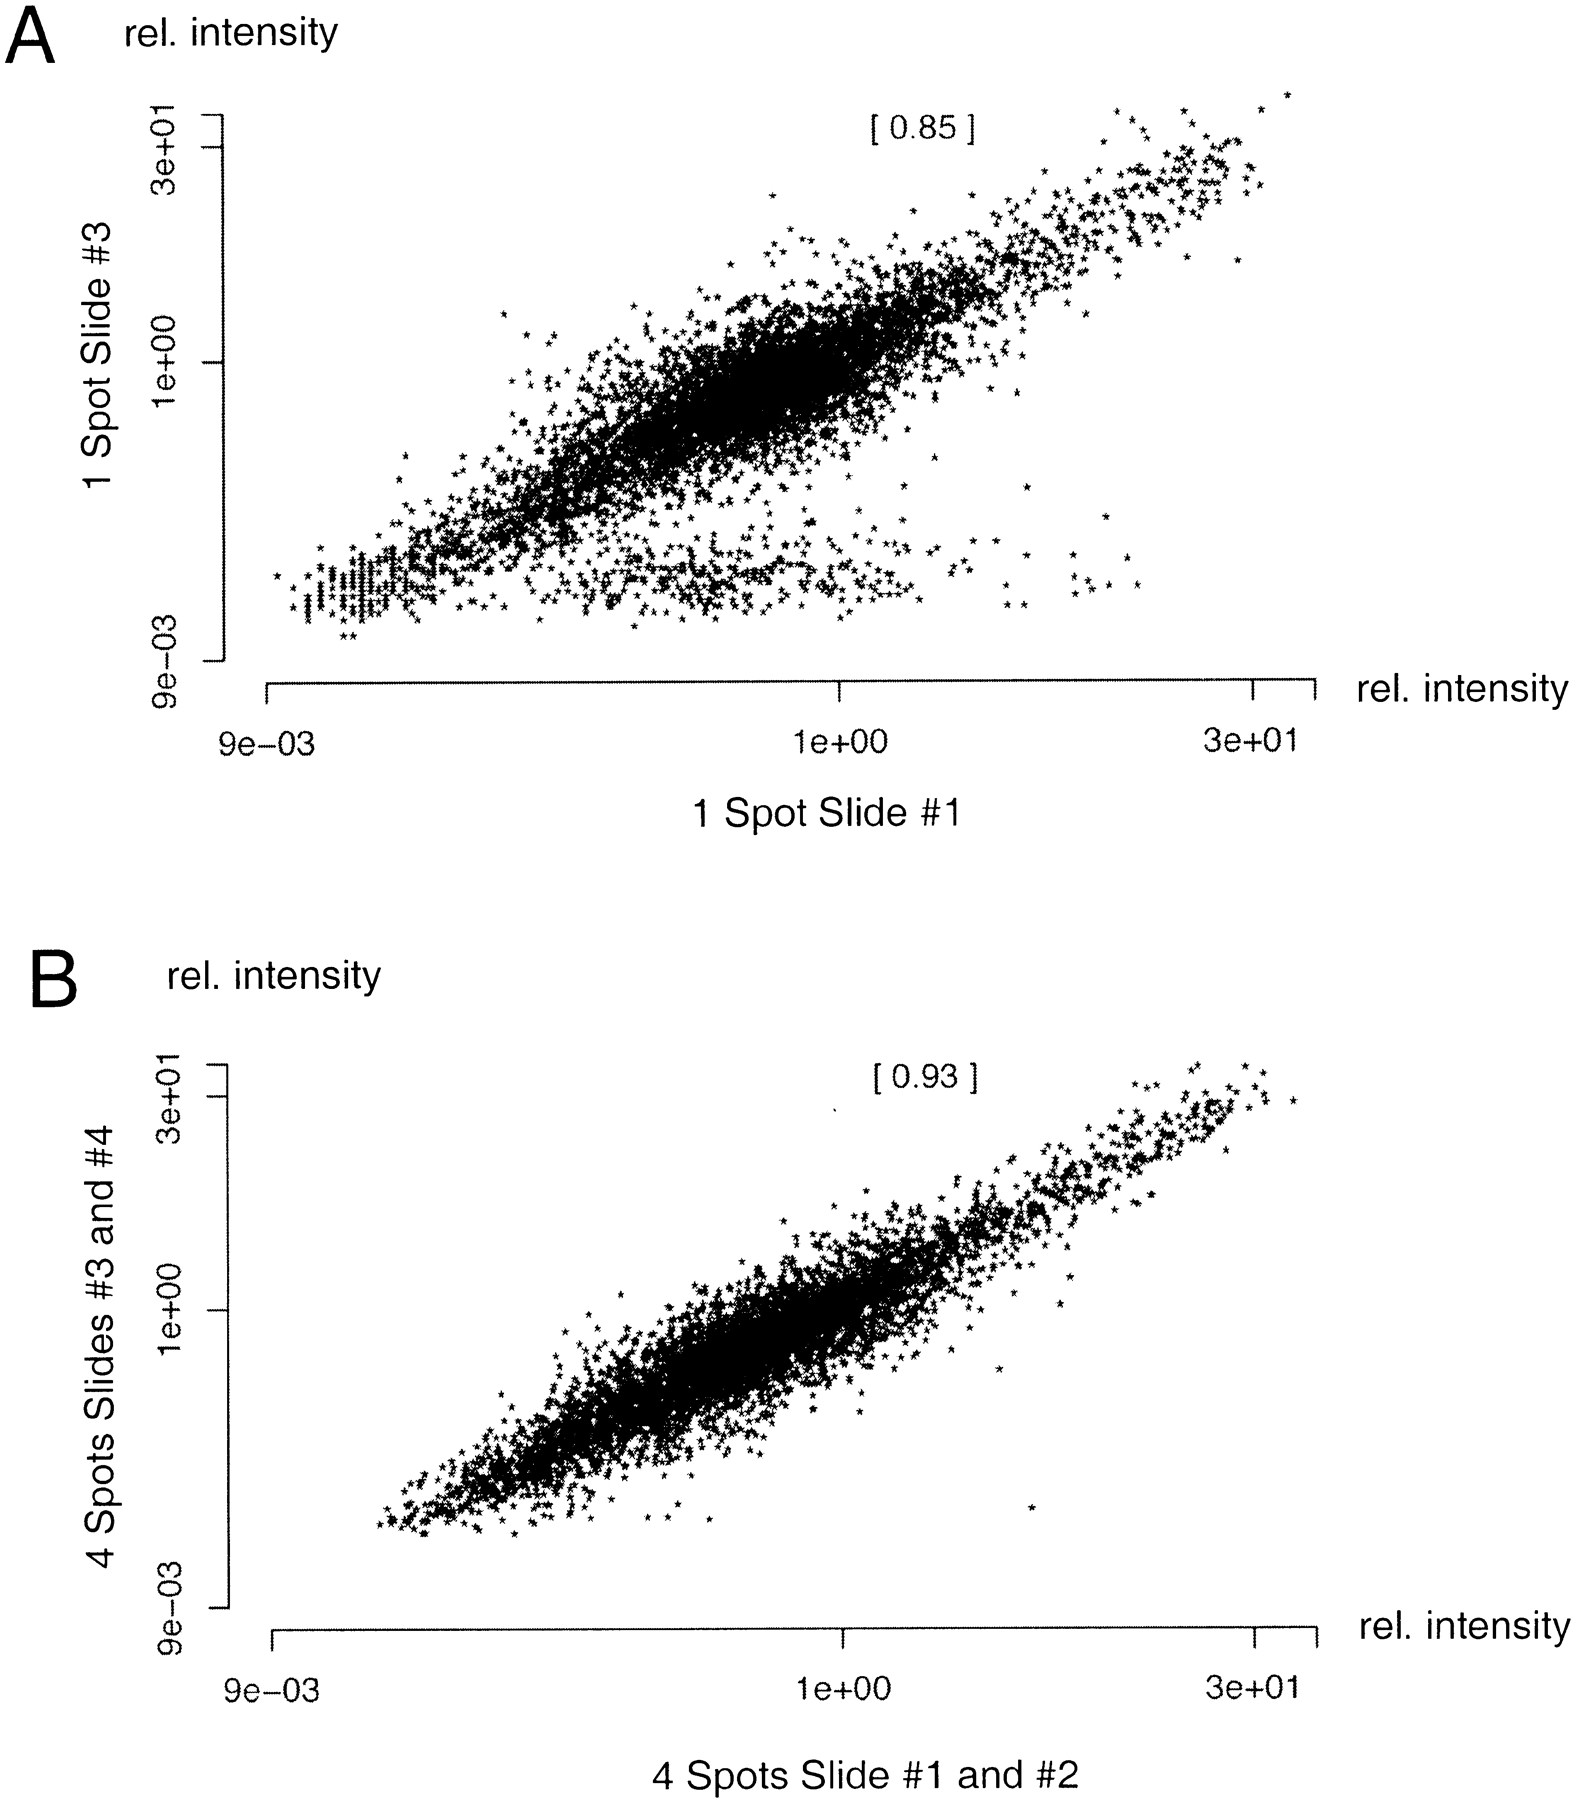
Figure 3.
Statistical analysis of complex cDNA hybridization results. The scatter plots visualize the reproducibility obtained for muscle mRNA in the experiments described here. Figure 3A displays the relative median signal intensities of all genes or spot locations on slide 1 compared with the same spots on slide 3. The correlation coefficient for this comparison was determined to 0.85. The correlation coefficient (given in brackets in Fig. 3A and 3B) is increased to 0.93 when all median intensity values for spots on slides 1 and 2 are compared with their analogues on slides 3 and 4.


