
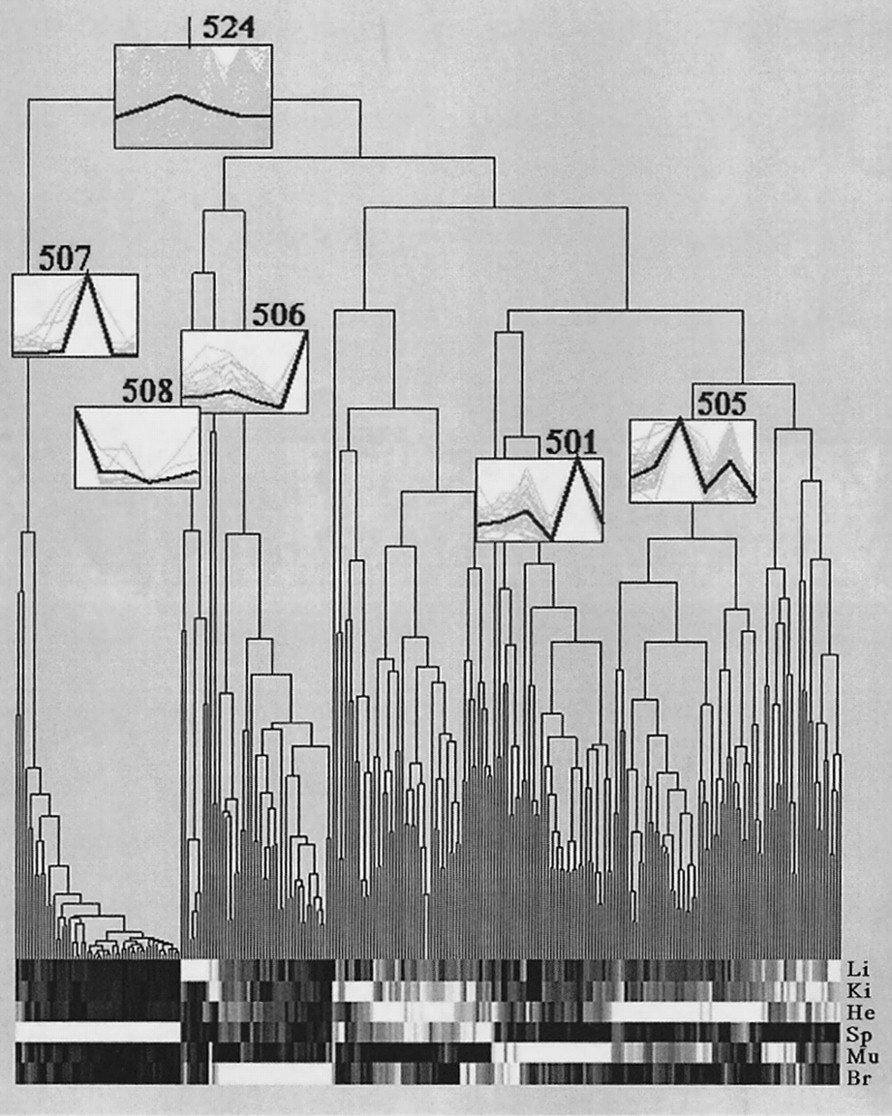
Clustering of 263 genes showing tissue-specific expression. The obtained dendrogram visualizes the normalized expression values for the selected tissues in 65,536 grayscales. White color stands for high expression, while black corresponds to complete gene repression. Like in Figure 4, spleen is the most apparent tissue because the subtree corresponding to spleen (507) is the first one being separated from all other tissue-specific subtrees. The consensus vector (bold lines) is given in the numbered boxes in the clustering diagram and represents the mean expression values of the cluster members (thin lines). Li, liver; Ki, kidney; He, heart; Sp, spleen; Mu, muscle; Br, brain.


