
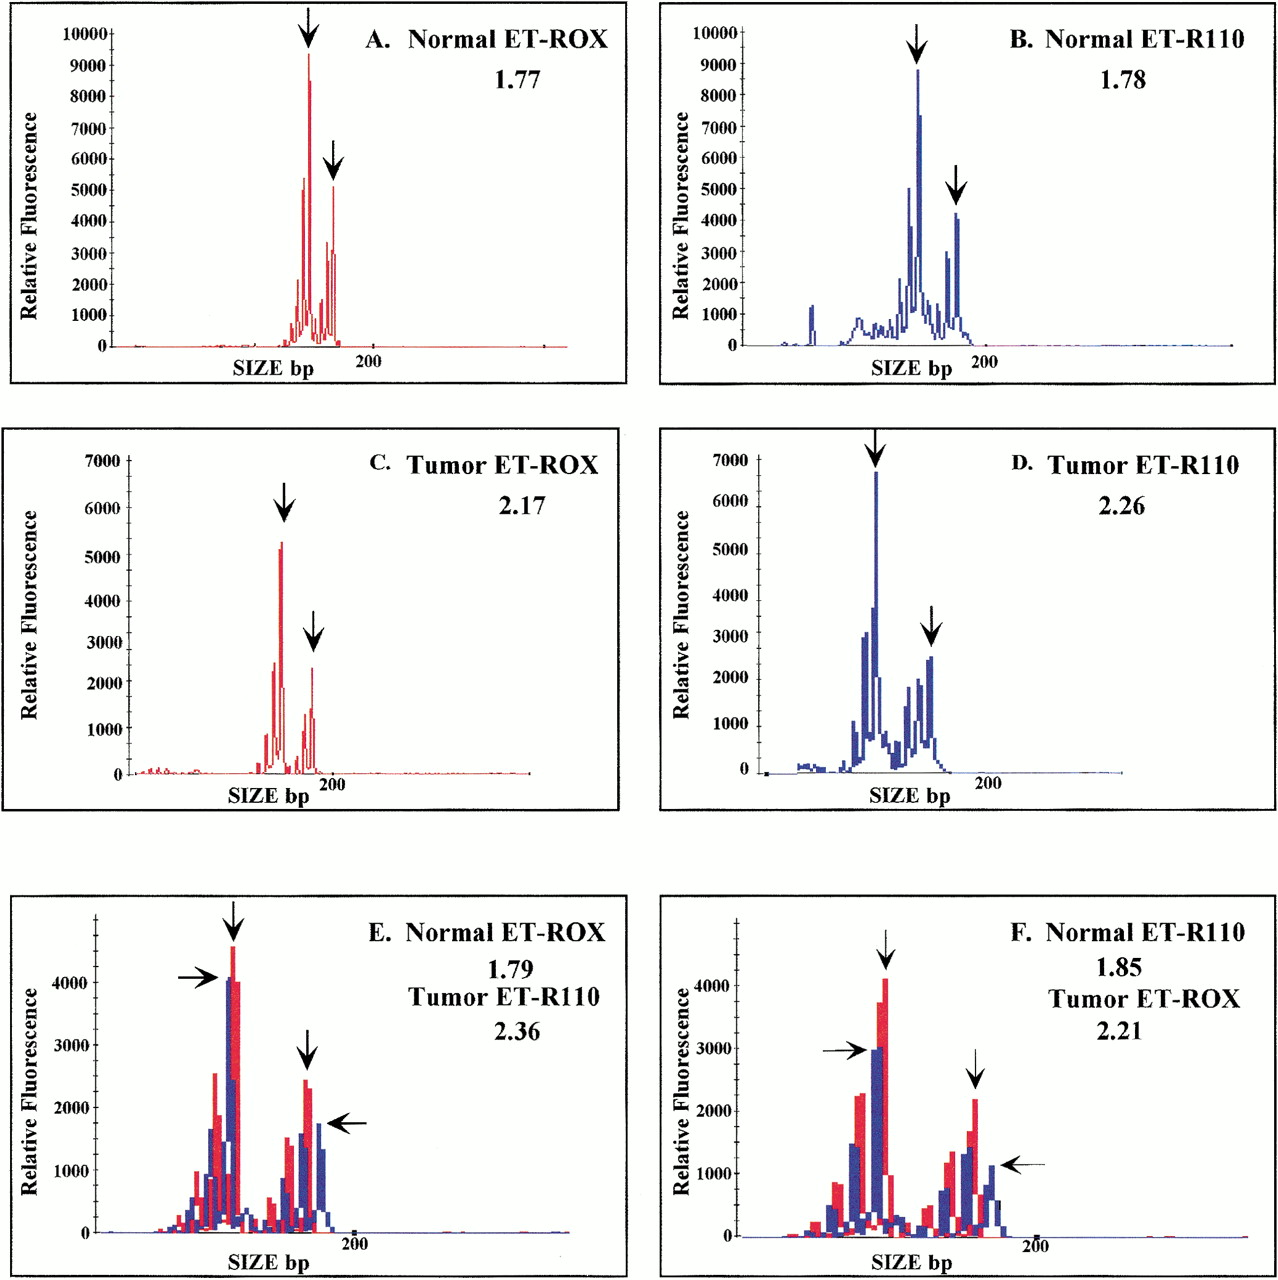
Figure 2.
Two-color LOH assays using complex samples (sample set 10). (A,B) Electropherograms from a normal sample amplified at the D9S171 locus with both ET-ROX (red) and ET-R110 (blue) primers. (C,D) Electropherograms from the matching tumor samples with both primer sets. (E,F) The resulting electropherograms from co-injected two-color samples. The numbers given at the right of each panel are the allelic ratios. The arrows indicate the peaks used for allele ratio determination.


