
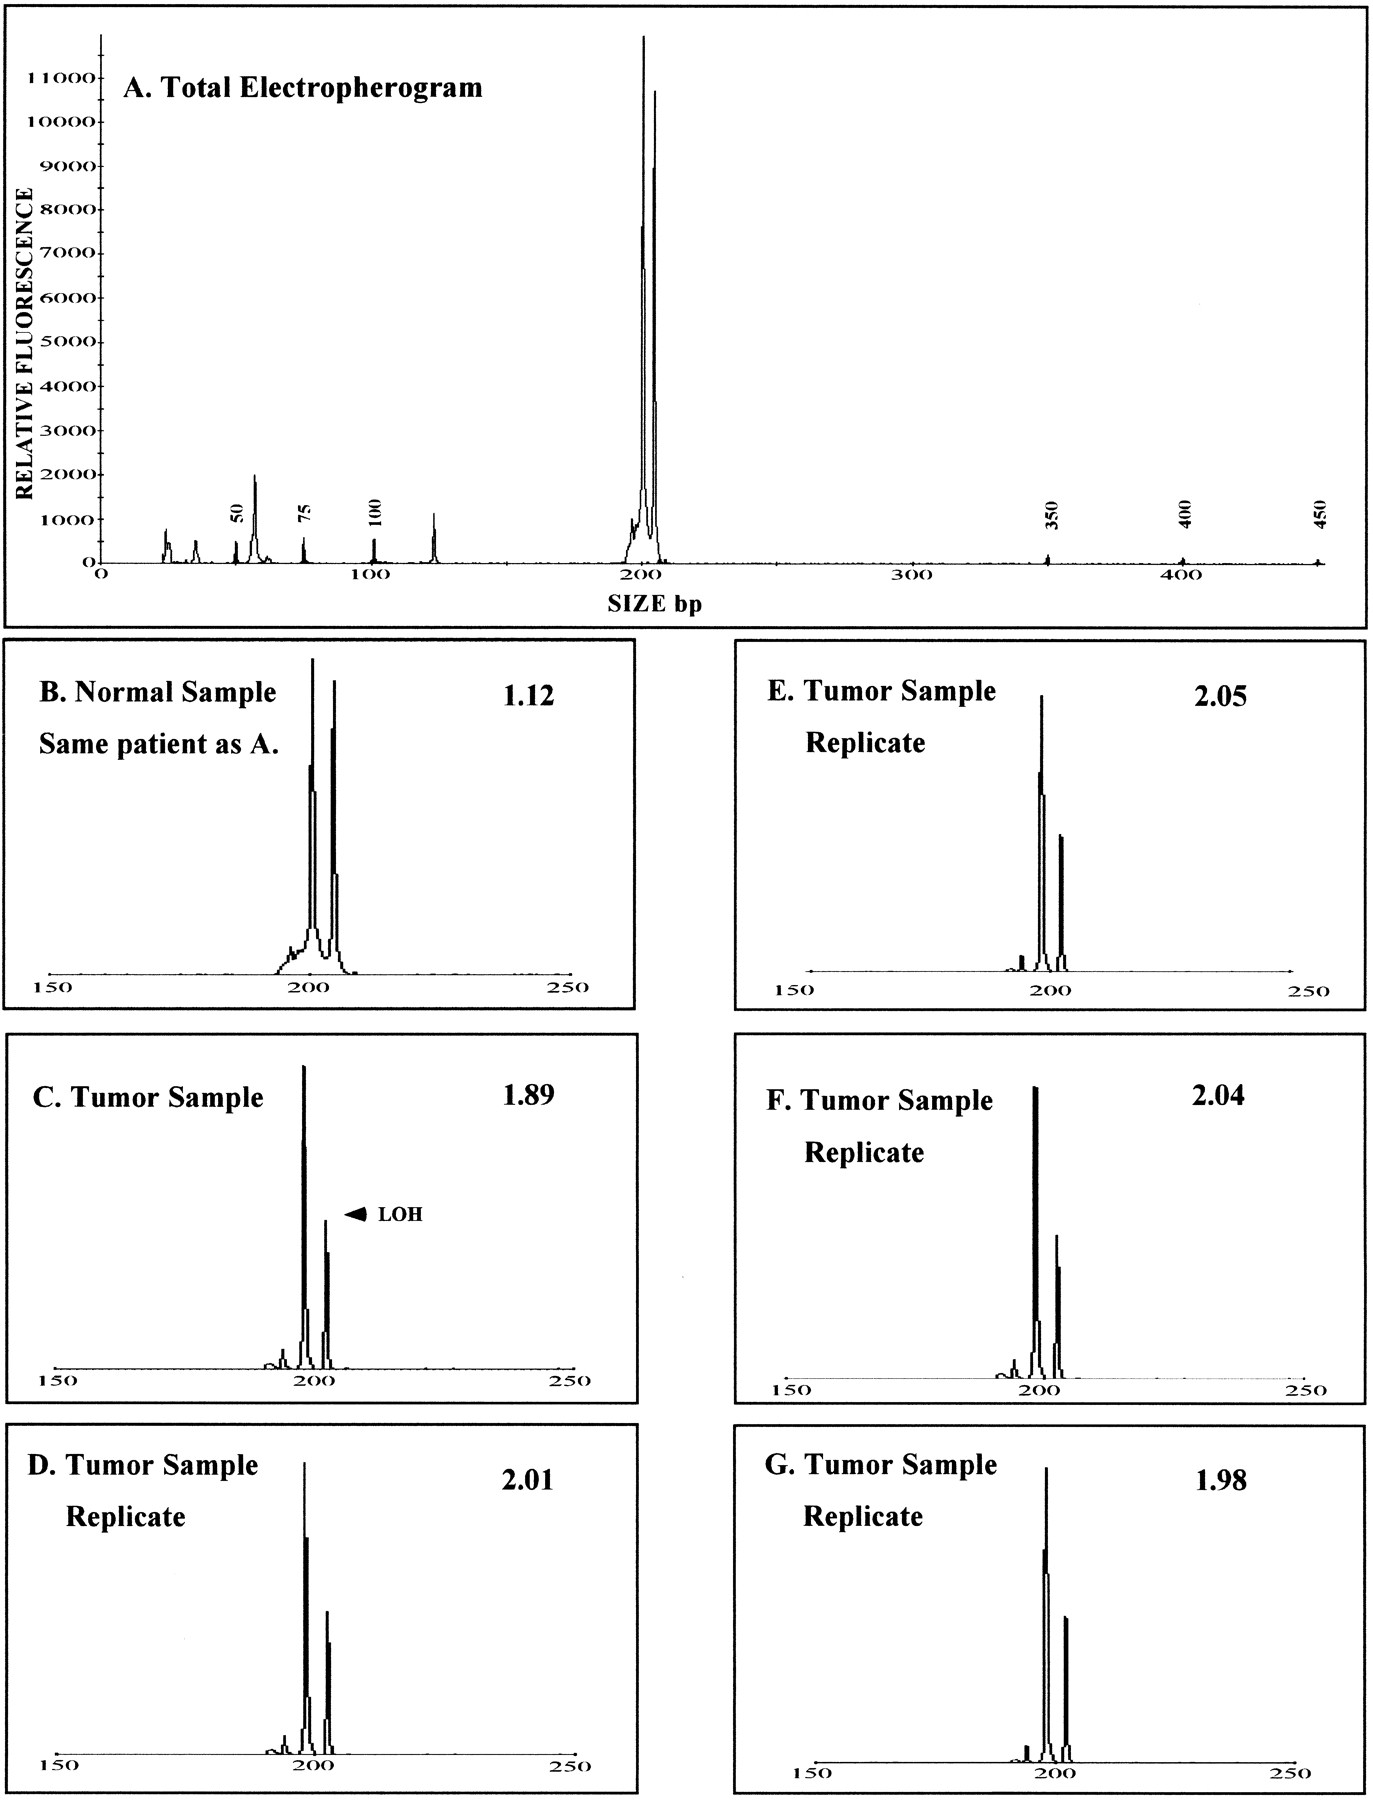
Figure 1.
Comparison of normal and tumor samples demonstrating LOH from sample set 10. Samples were amplified at the D9S747 locus with the ET-ROX primer. Relative fluorescence is plotted against the size of the PCR product. (A) Total electropherogram of the normal sample along with the sizing standards. (B,C) Electropherograms from a normal lymphocyte control and a tumor sample from the same patient. (D–G) Replicate injections in multiple capillaries of the tumor sample. The allele ratios are given in the right corner of each panel. See the Methods section for run conditions.


