
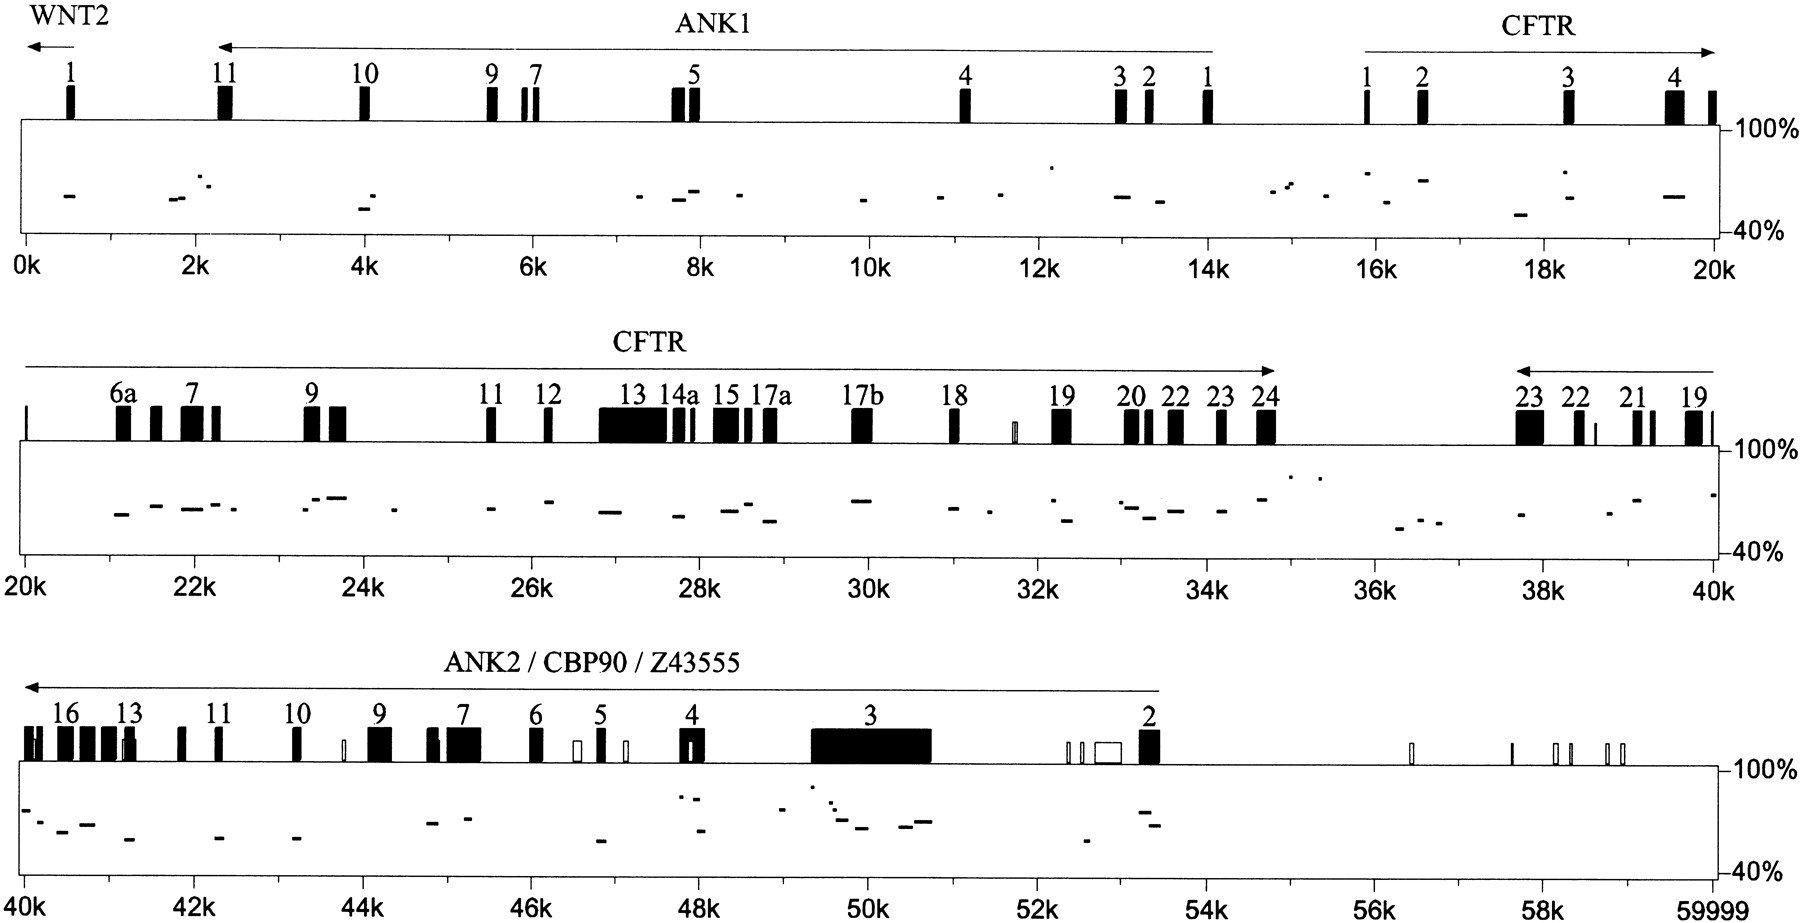
Genomic conservation and organization. Percentage identity plot (PIP) analysis of Fugu CFTR genomic region compared with the equivalent human region. Protein-coding exons are indicated by black rectangles. Gray and white boxes indicate 0.75 and 0.60 CpG:GpC ratios, respectively. Horizontal lines show blocks of homology between the Fugu and human sequences. Only blocks of homology occurring in the same relative order in both sequences are indicated by horizontal lines. Genes identified within theFugu genomic sequence are annotated and transcriptional orientation indicated above the appropriate exons. Exons of genes are numbered where space permits.


