
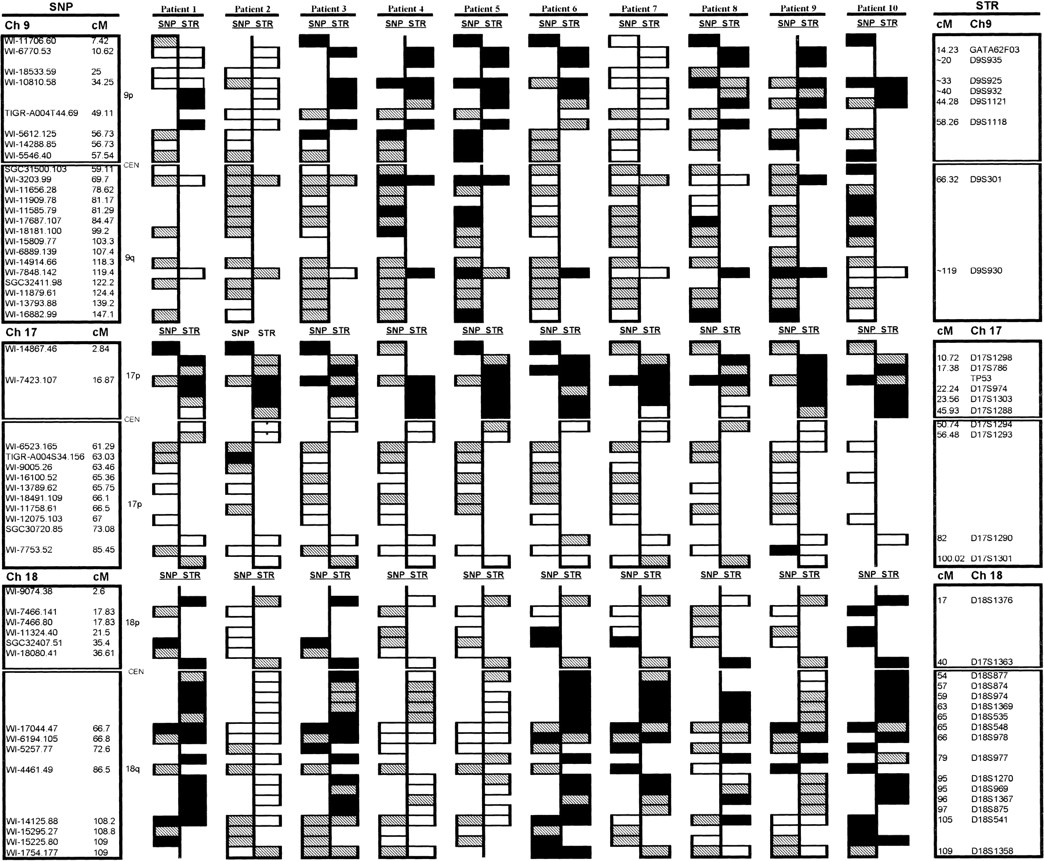
Comparison of the SNP array-based and microsatellite STR-based analyses for chromosomes 9, 17, and 18. For each normal and aneuploid pair, the SNP results are shown on the left and the STR results on theright. For the SNP data, allelic imbalance was called if theP̂ value for the normal sample was within the range 25 ≤ P̂ ≤ 75, the P̂ value for the aneuploid samples was P̂ ≤ 25 orP̂ ≥ 75, and if ‖ ΔP̂ ‖ > 20 between normal and aneuploid samples. For the STR data, allelic imbalance was determined by use of the formula [aneuploid allele height A/B]/[normal allele height A/B] and was called if the ratio was <0.4 or >2.5, depending on which allele was lost. (Open rectangles) Retention of heterozygosity; (closed rectangles) allelic imbalance; (hatched rectangles) non-informative loci. The two techniques were said to be in agreement if adjacent loci from both approaches showed either allelic imbalance or if both were heterozygous (excluding regions that were non-informative). (*) STR markers with allele ratios that were only slightly below the threshold for scoring LOH. These may represent instances of polysomy.


