
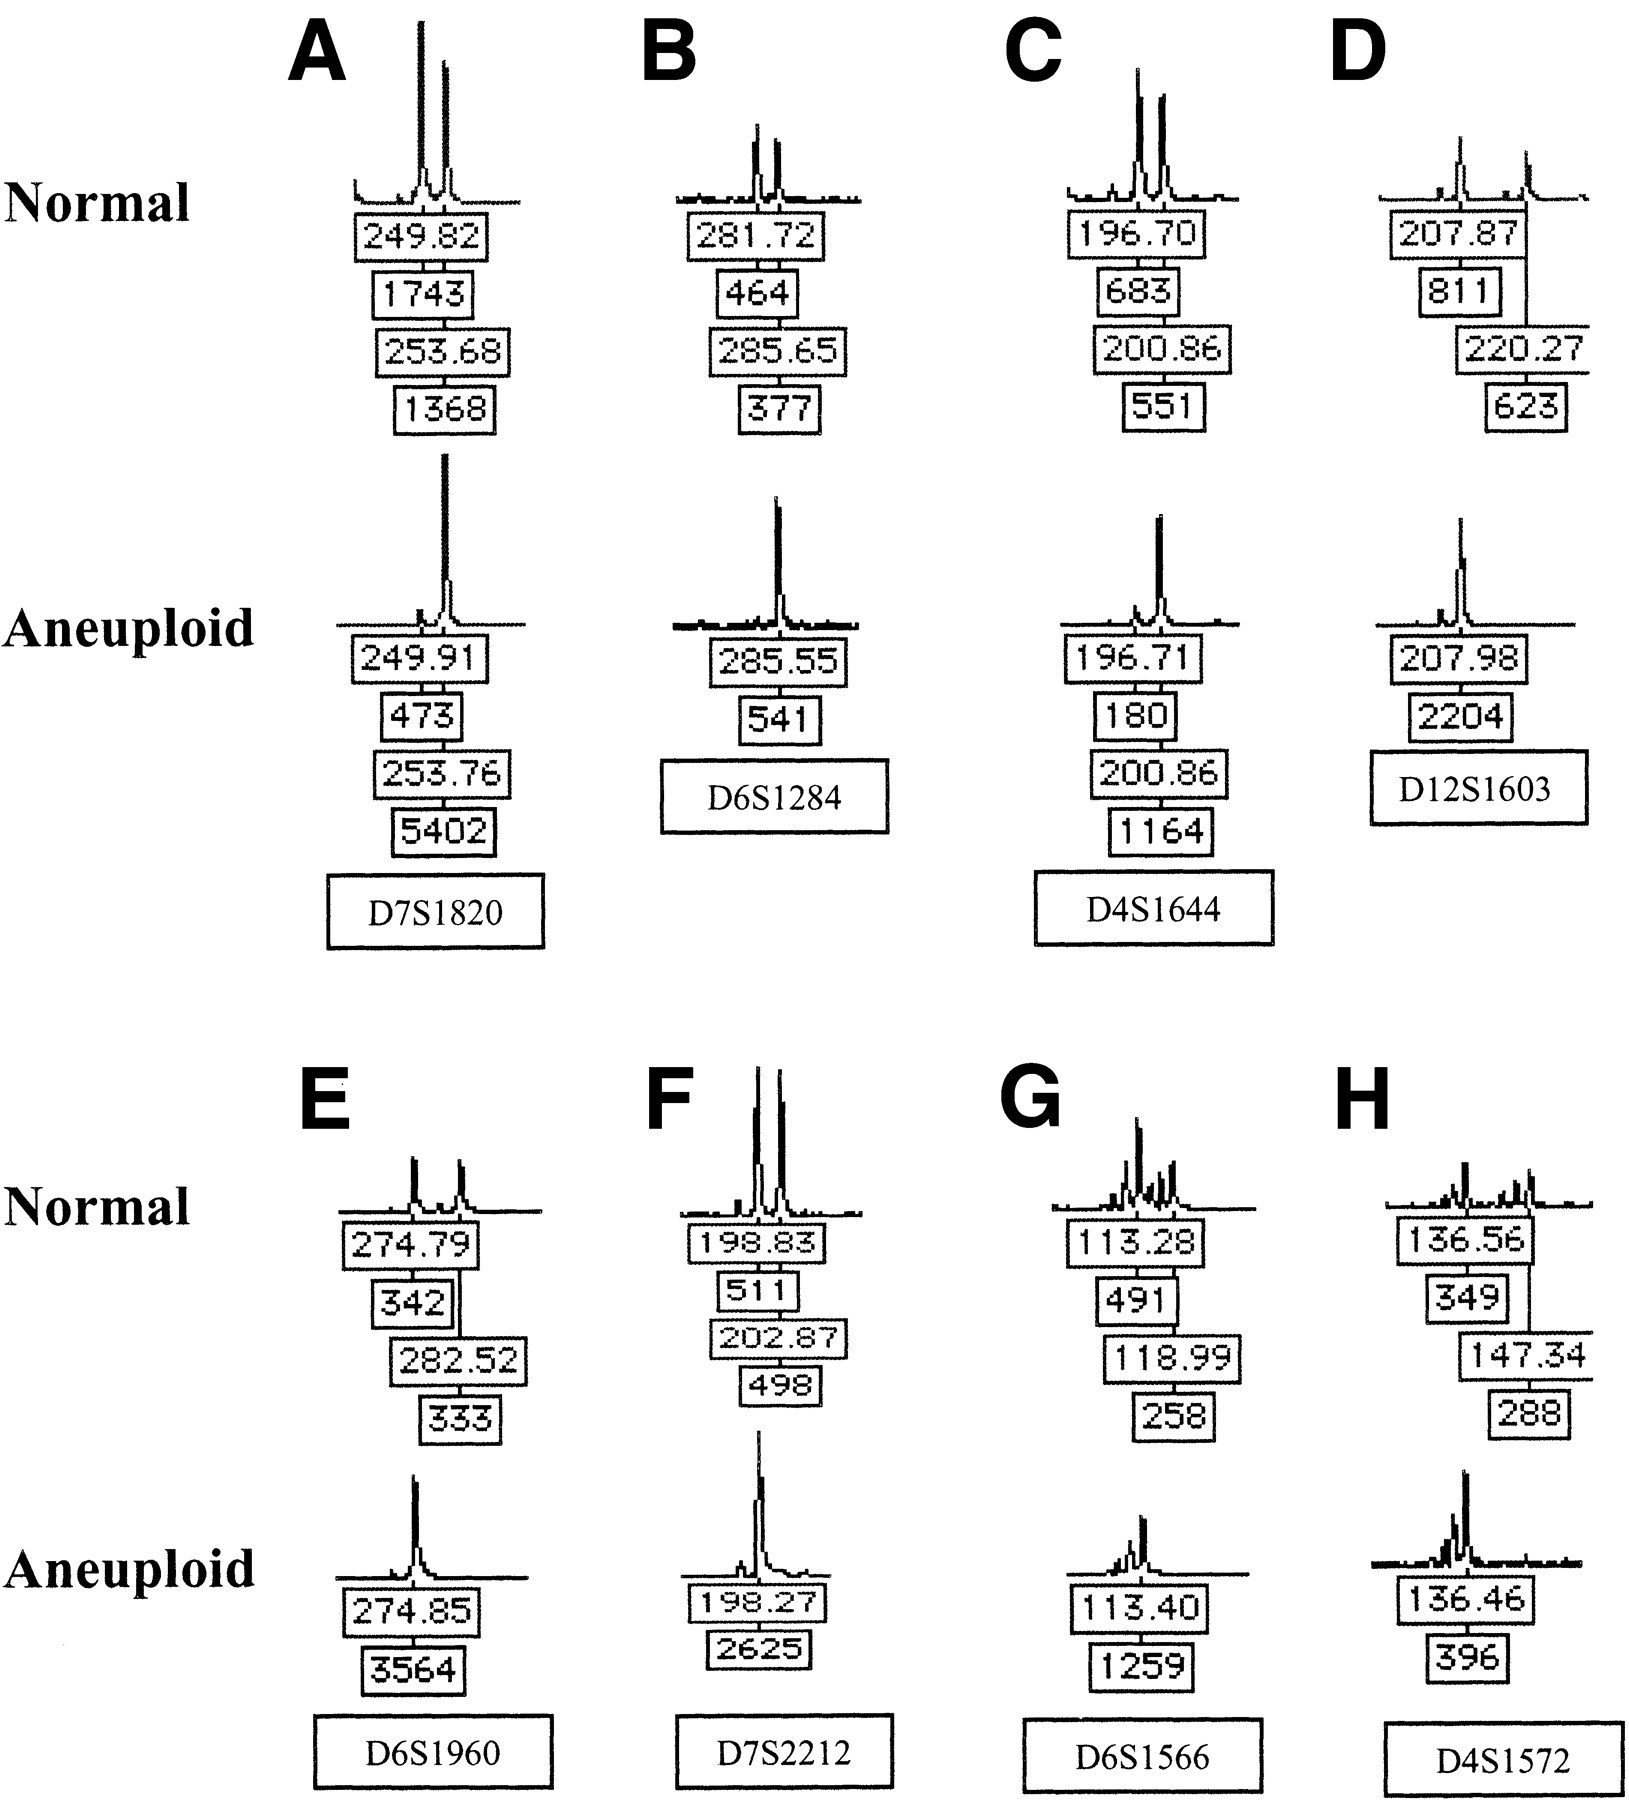
Representative examples of LOH assessed by gel-based STR analysis. Shown are examples of loss (in the aneuploid populations) of the shorter allele of tetranucleotide repeats (A–C), loss of the longer allele (D–F) and loss with dinucleotides repeats (G,H). For each allele, the repeat lengths and peak heights (fluorescent units) are shown, and the locus name is given below each normal/aneuploid pair. Allelic imbalance was measured by fluorescence intensity of the shorter allele A relative to that of the longer allele B; (A/B) in the aneuploid sample, relative to a normal constitutive control. Ratios <0.4 or >2.5 (depending on which allele was lost) were considered to be indicative of allelic imbalance, although the majority of loci showed complete loss of an allele.


