
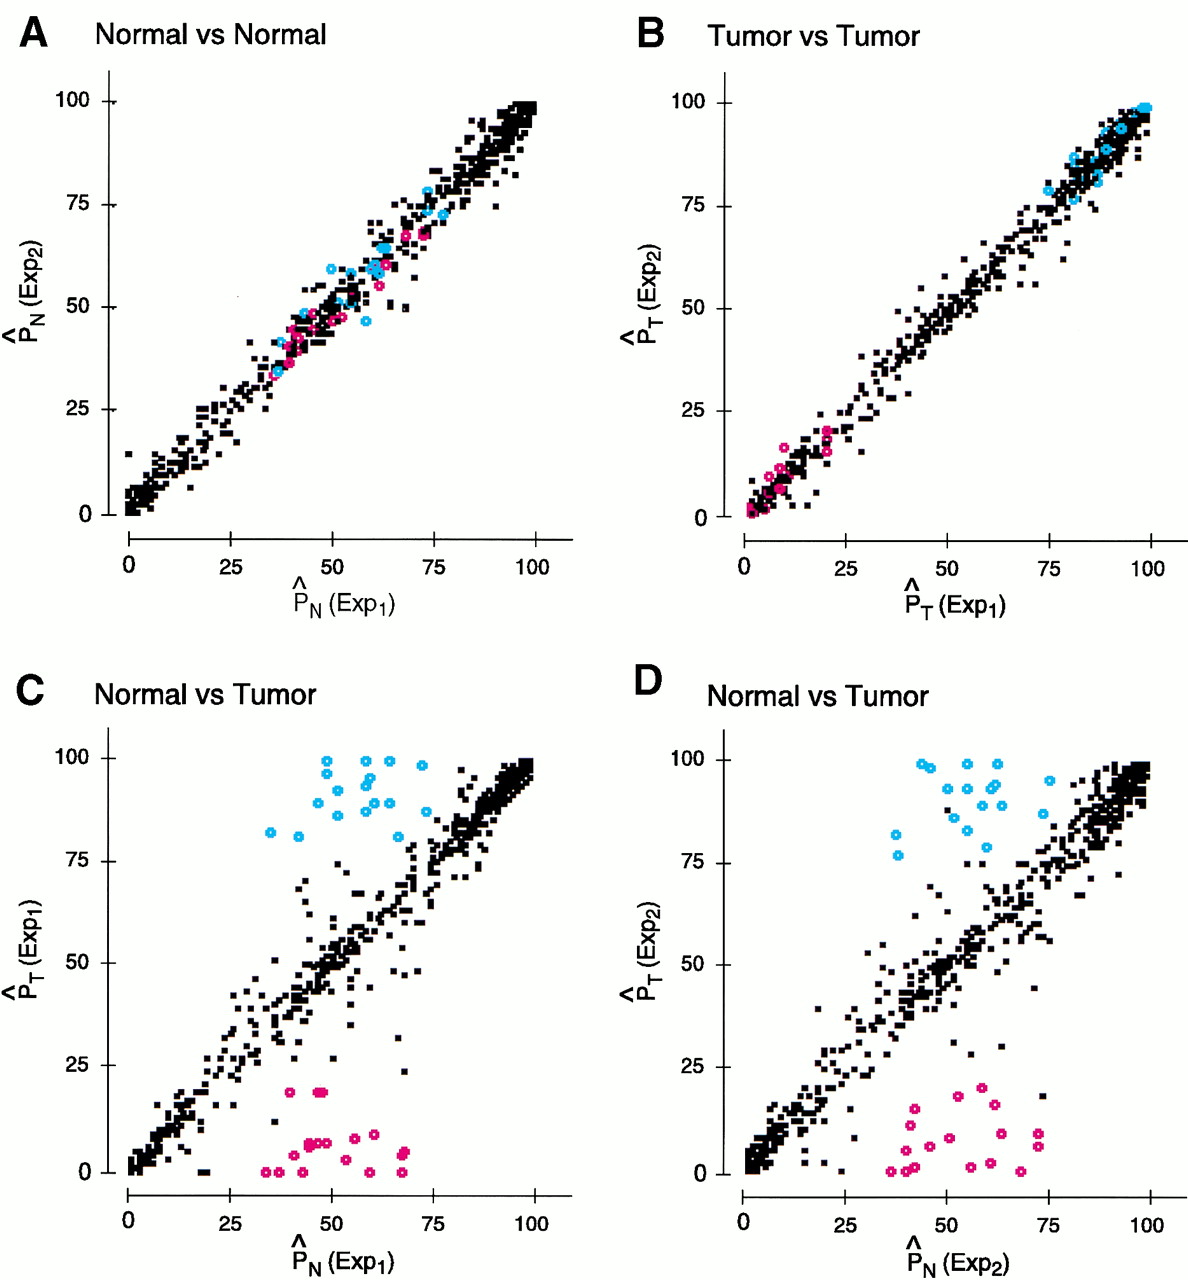
Reproducibility of the SNP array-based analysis. Loci were independently amplified and labeled three times from a pair of normal and aneuploid DNA samples. The paired samples generated by the three independent preparations were hybridized to six SNP arrays. The sample amplification, labeling, and hybridization procedures and conditions are as described in Methods. (A) Linear correlation plot for normal replicates. [P̂ N(Exp1) and P̂ N(Exp2)] CalculatedP̂ values for normal samples in experiments 1 and 2, respectively. (B) Linear correlation plot for tumor (aneuploid) replicates. [P̂ T(Exp1) and P̂ T(Exp2)] Calculated P̂values for aneuploid samples in experiments 1 and 2, respectively. (C,D) Correlation between the normal and the aneuploid samples for experiment 1 and 2, respectively. (Blue and red circles) Loci scored as allelic imbalance events in both replicates. In the normal samples, theP̂ values for these loci were within the heterozygous range (75 ≥ P̂ ≥ 25), whereas in the aneuploid samples, the same loci were within the homozygous range [ P̂ ≤ 25 (red circles, homozygous BB) orP̂ ≥ 75 (blue circles, homozygous AA)]. (Black solid dots) Non-informative loci (P̂ ≤ 25 orP̂ ≥ 75 in the normal) or heterozygous loci with no allelic imbalance.


