
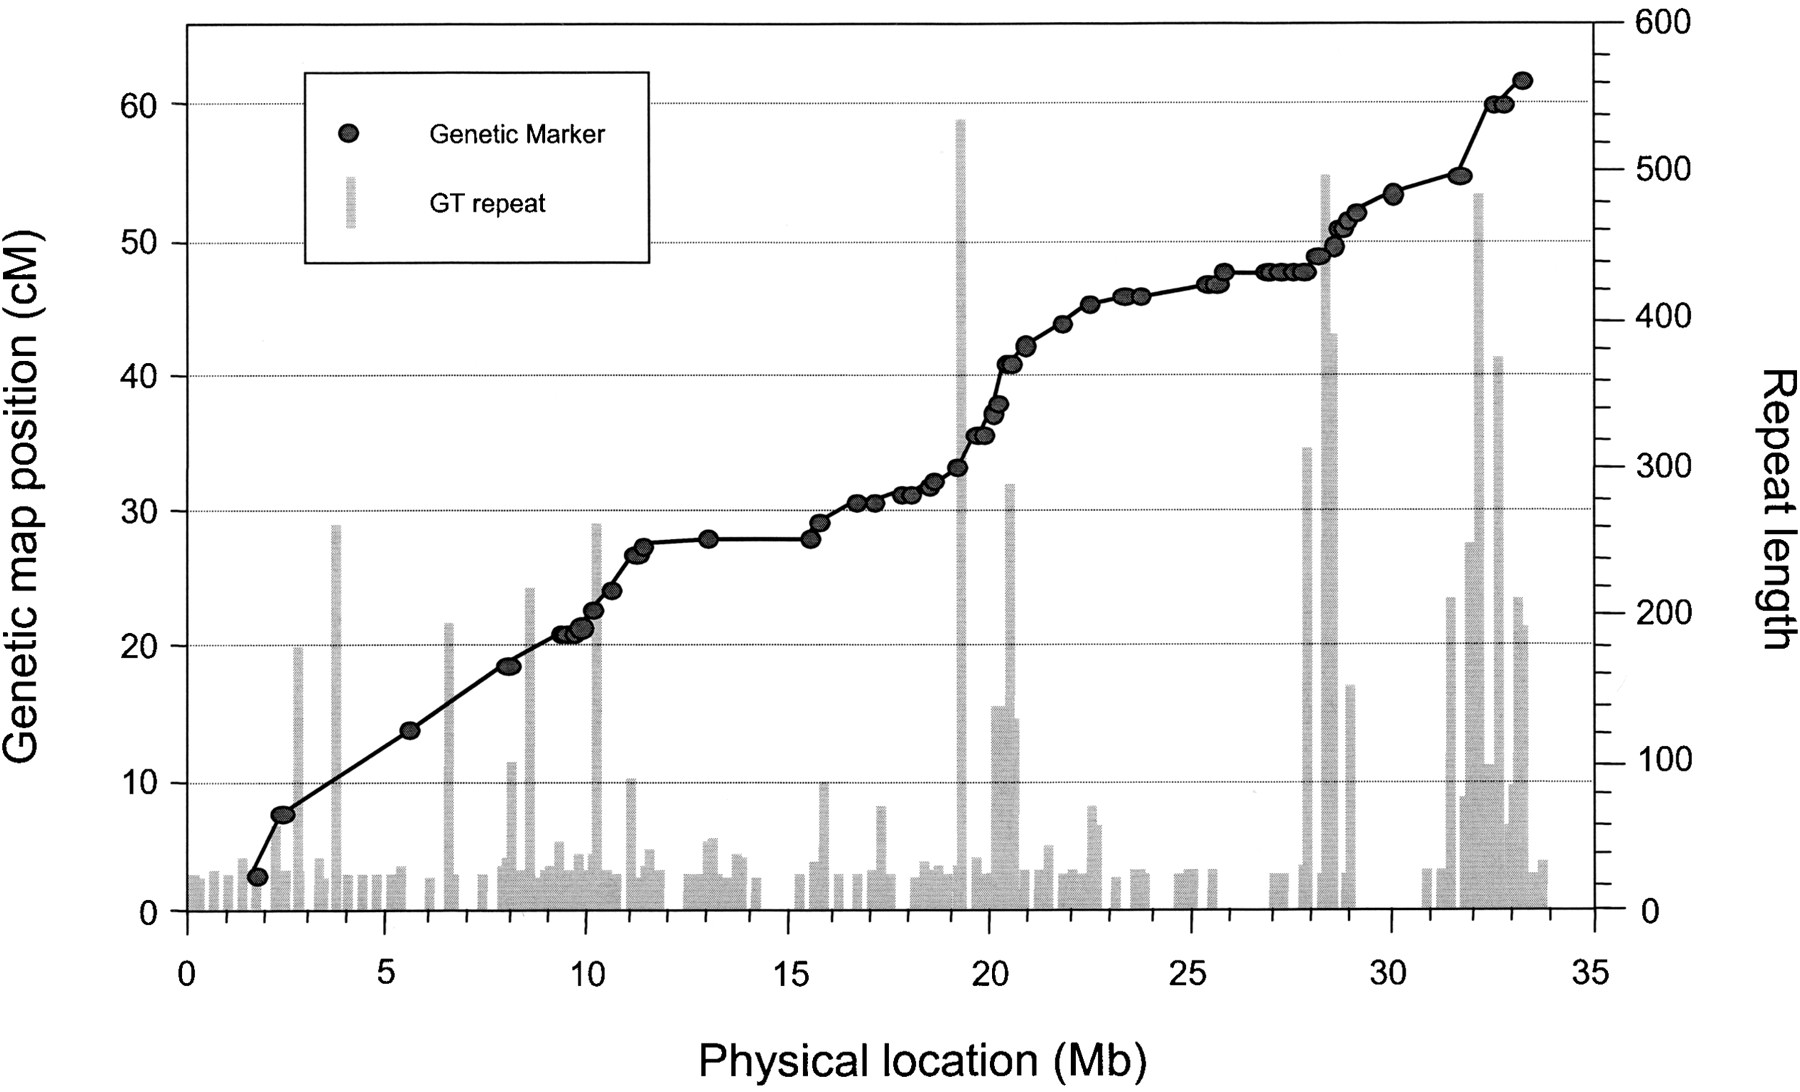
Association of microsatellite GT repeats with recombination hot spots. The physical location and size of each GT repeat are superimposed on the plot of genetic map location (sex-averaged) against physical location for 59 markers on human chromosome 22. The height of each vertical bar represents repeat length. The slope of the line indicates relative recombination intensity within each intermarker region. Note that the locations of long GT repeats, as well as high concentrations of GT repeats, correspond to regions with elevated recombination rates. Conversely, regions with relatively few repeats have moderate or low recombination rates.


