
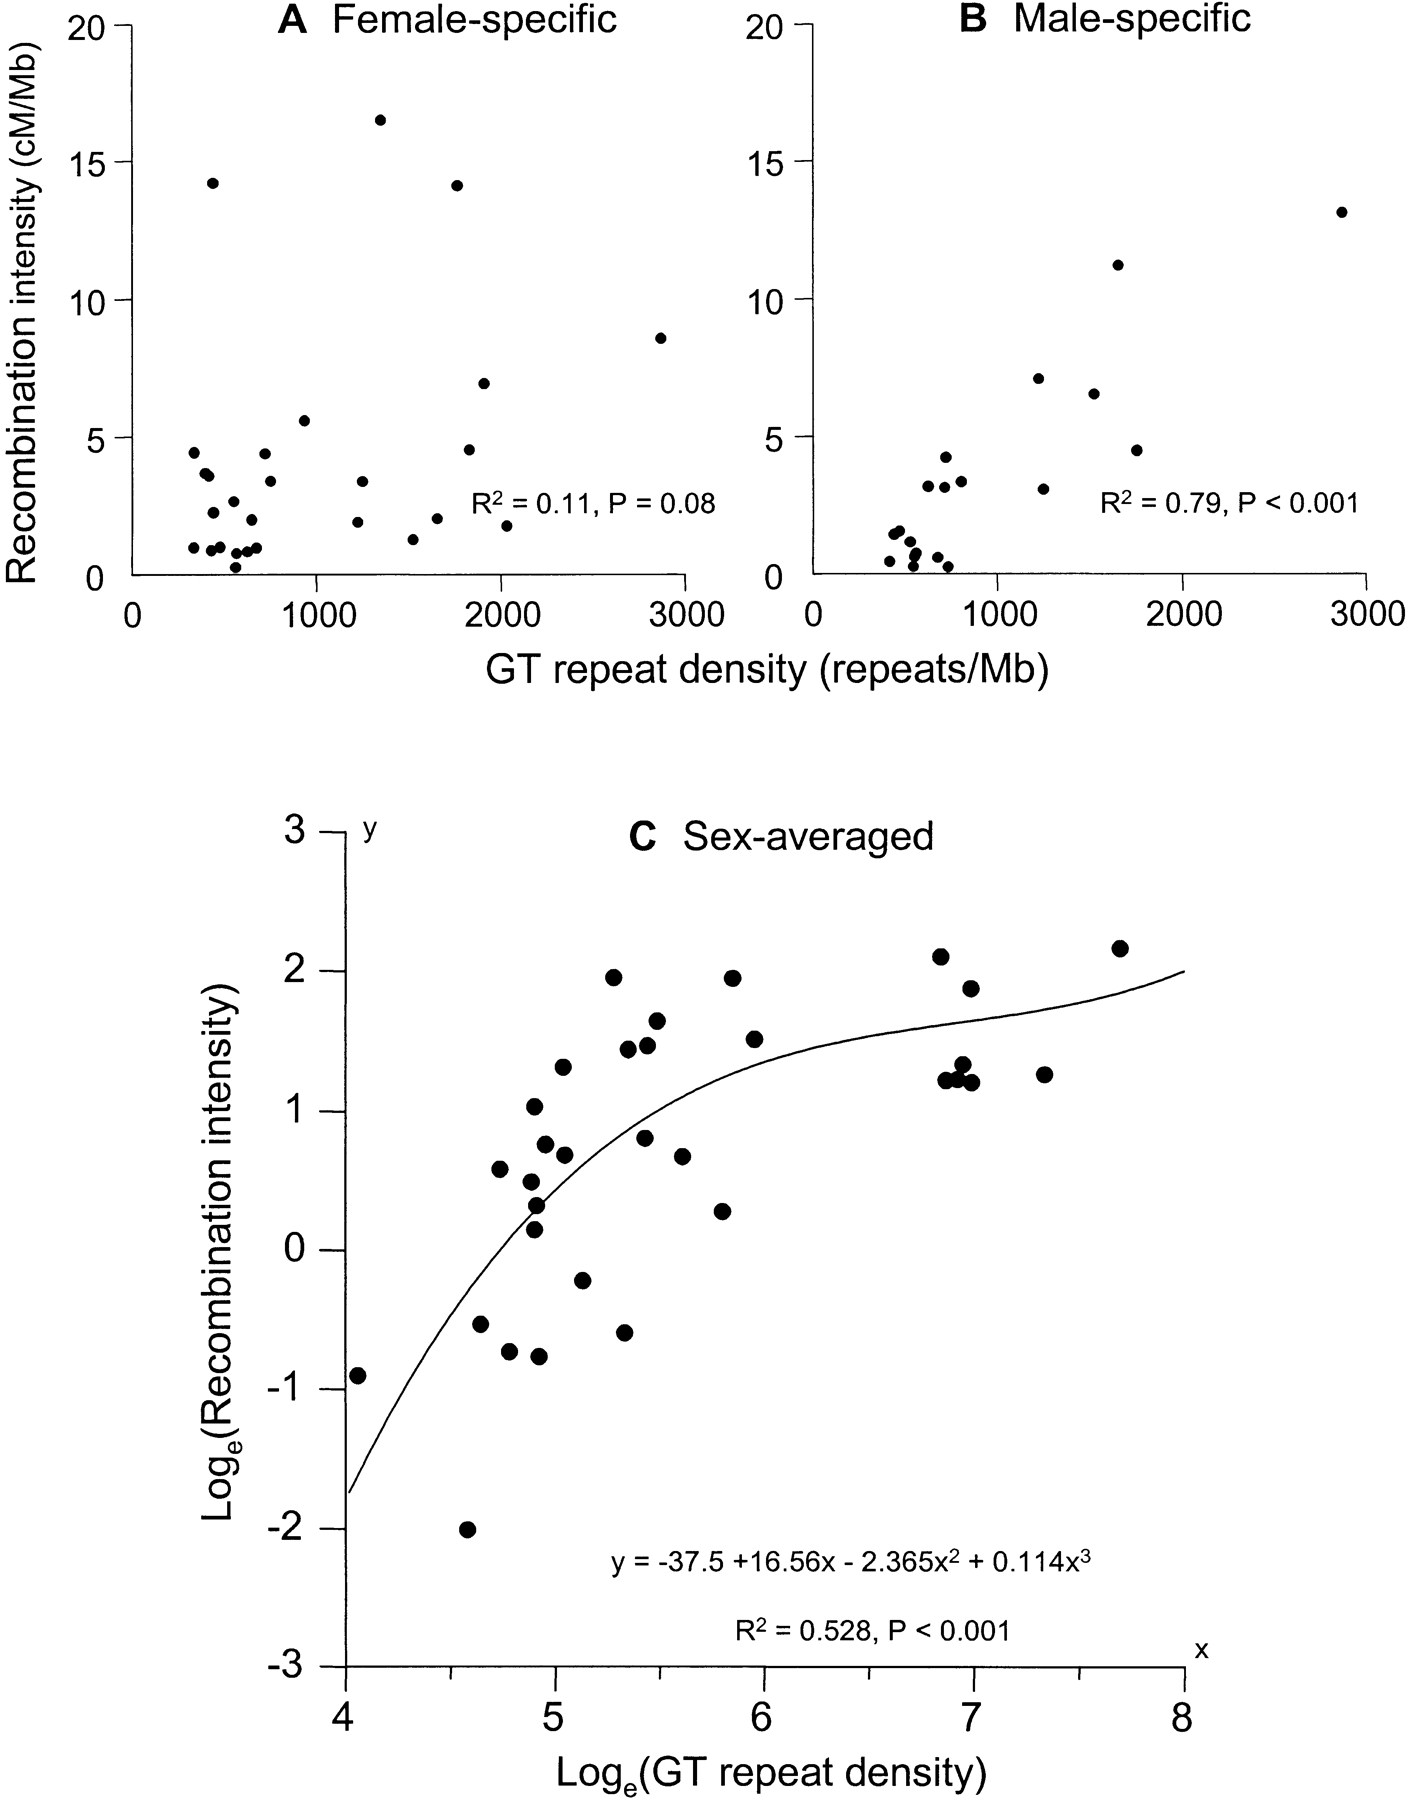
Positive relationship between recombination intensity and GT repeat density. (A and B) Scatter-plots for females and males, respectively. The relationship is much more pronounced in males than in females and may in fact be mostly caused by the male-specific effect. (C) Sex-averaged results. The best fit for curvilinear regression was obtained by log-transforming the data and including second- and third-order polynomial terms. The line represents the regression curve given by the equation shown, where y = loge(recombination intensity) and x = loge(GT repeat density). The relationship is highly significant (R2 = 0.528,P = 8.7 × 10⁻⁵). The relationship is characterized by an initial rapid increase of recombination intensity with GT density, followed by a decline in the rate of increase. The recombination intensity possibly tends toward an asymptotic value for high repeat density levels. Note that the slight increase in the curve at high GT repeat density is most likely an artifact of limiting the regression to the first three terms.


