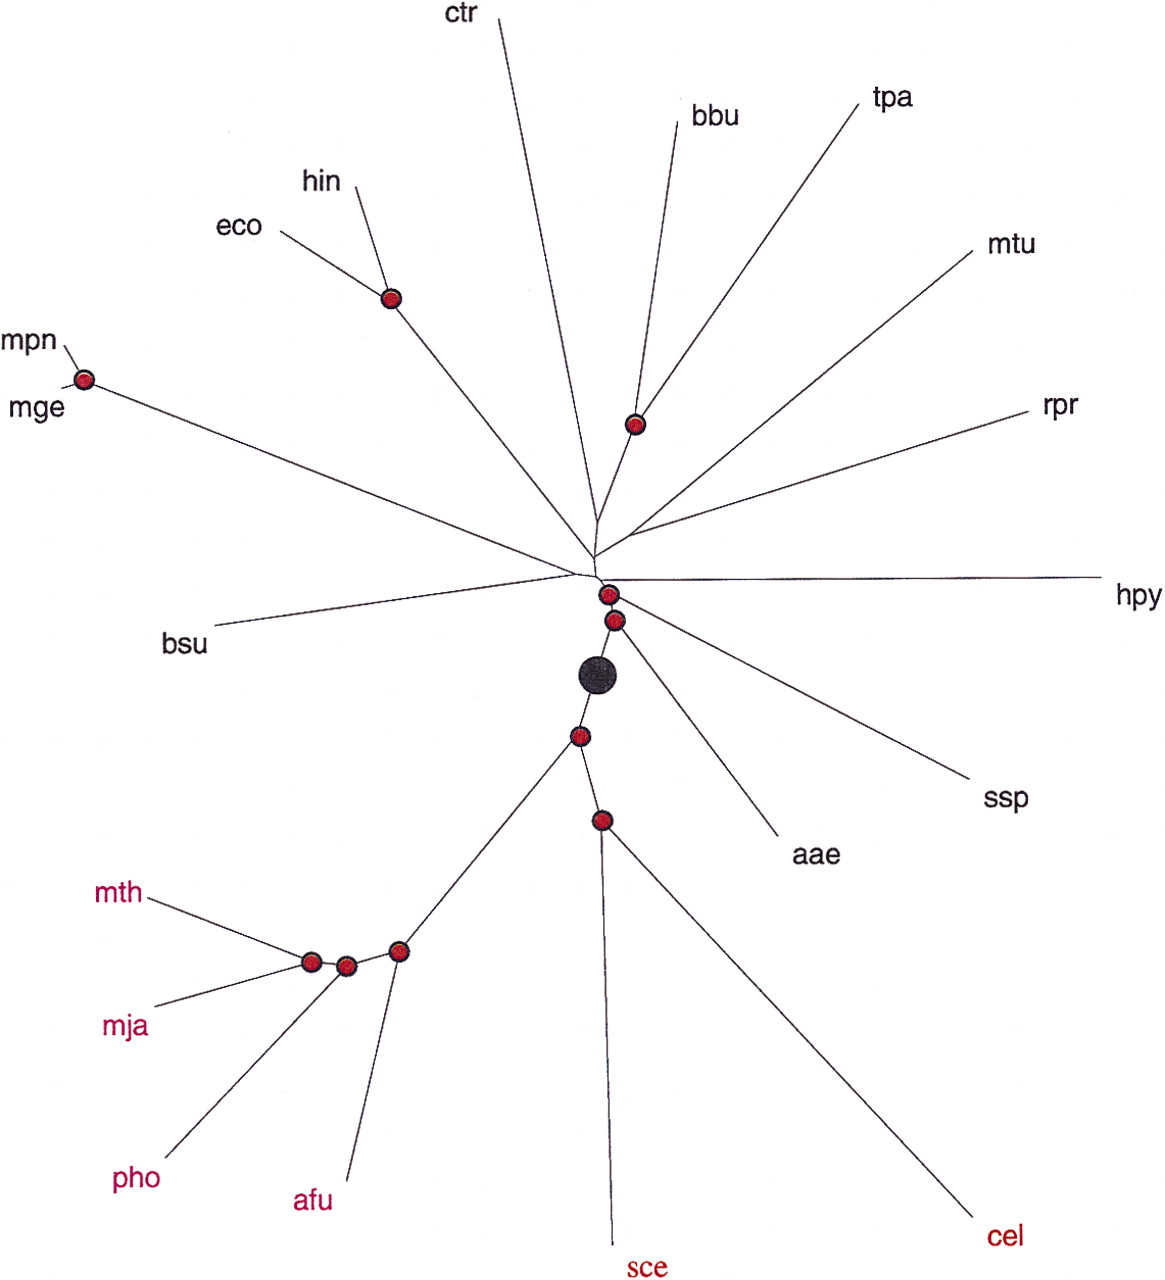
From Complete Genomes to Measures of Substitution Rate Variability Within and Between Proteins

(Downloading may take up to 30 seconds. If the slide opens in your browser, select File -> Save As to save it.)

Click on image to view larger version.

Figure 3.
Figure 3.

A phylogenetic tree for complete genomes. The nodes supported by bootstrap values >70% are marked by red dots. The inferred root position is indicated by a black circle. For genome designations, see Methods.

This Article

  1. Genome Res. 10: 991-1000

Preprint Server