
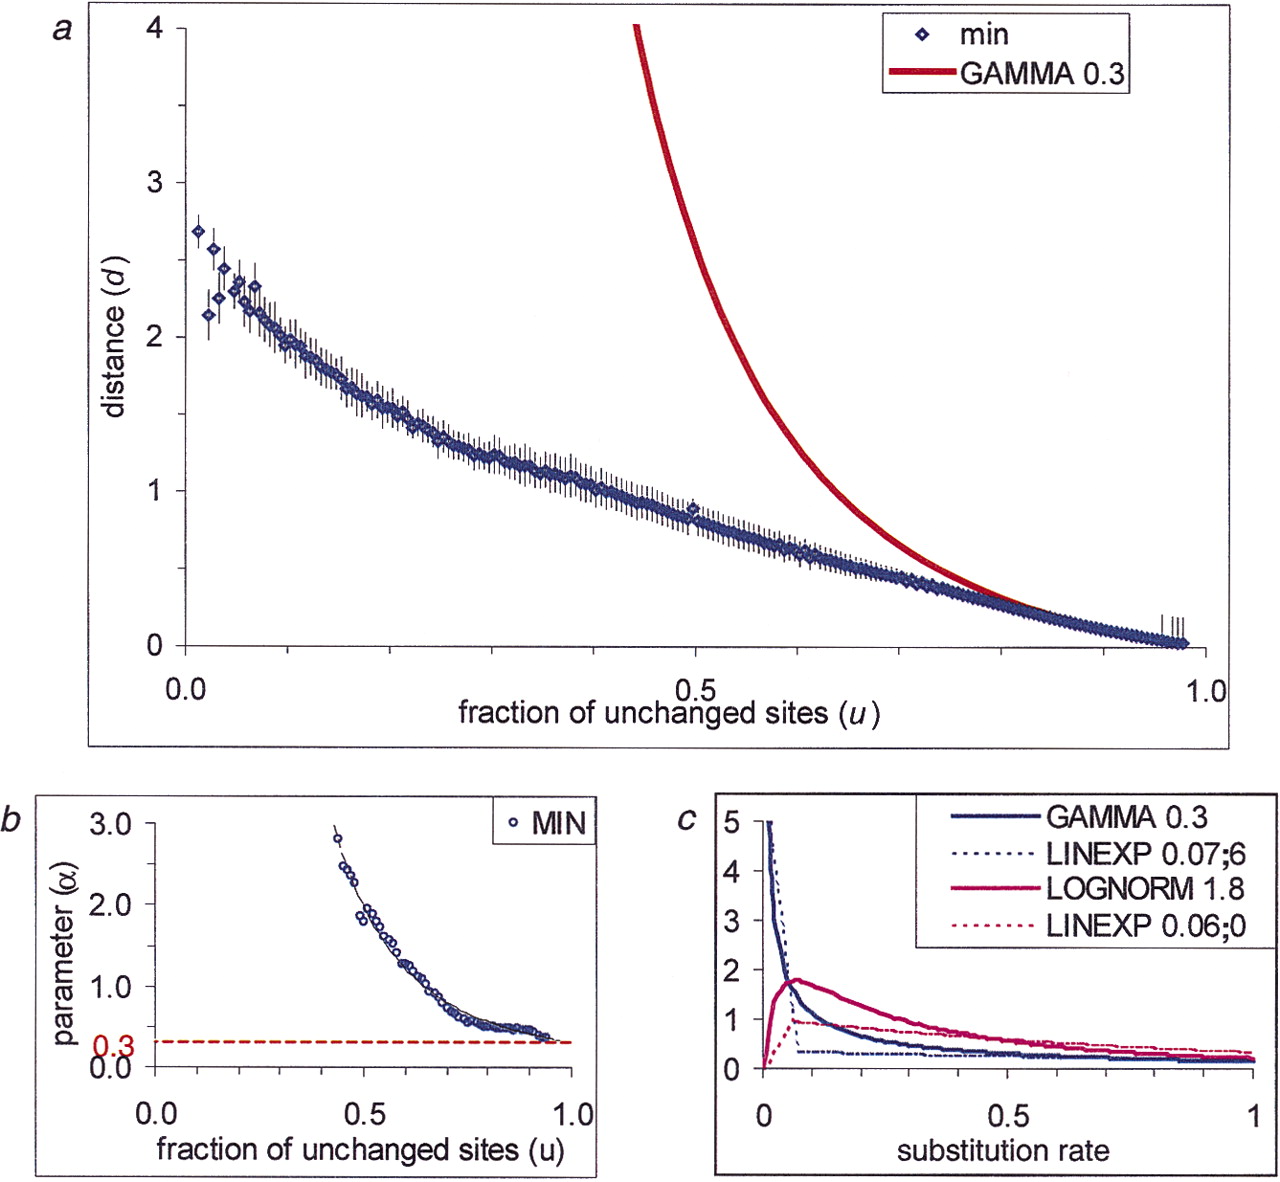
Intraprotein rate variation. (a) Dependence of the evolutionary distance d on the fraction of the unchanged sitesu estimated from multiple alignments. The curve designated “min” shows the lower bound of the estimated distances. The curve
“GAMMA 0.3” shows the d(u) dependency when the gamma distribution with α = 0.3 was used to describe intraprotein rate variation. (b) Estimation of the α parameter of the gamma distribution. The α values were extrapolated to u = 1. The obtained upper estimate for the α parameter is indicated by the red dotted line. (c) Probability density functions used to describe intraprotein rate variation. The figure illustrates two possible shapes of
the density function: the L-shaped gamma distribution (GAMMA 0.3) and the bell-shaped log-normal distribution (LOGNORM 1.8).
The parameter of the log-normal distribution was obtained by fitting the data from a in the same manner as for the gamma distribution. Dotted lines (LINEXP a;b) show two examples of the combination of linear and exponential densities given by the formula where A is a normalization constant andc is determined from the requirement of the mean xbeing equal to 1. The parameter a gives the point where the linear approximation ends; the parameter b determines the intercept.


