

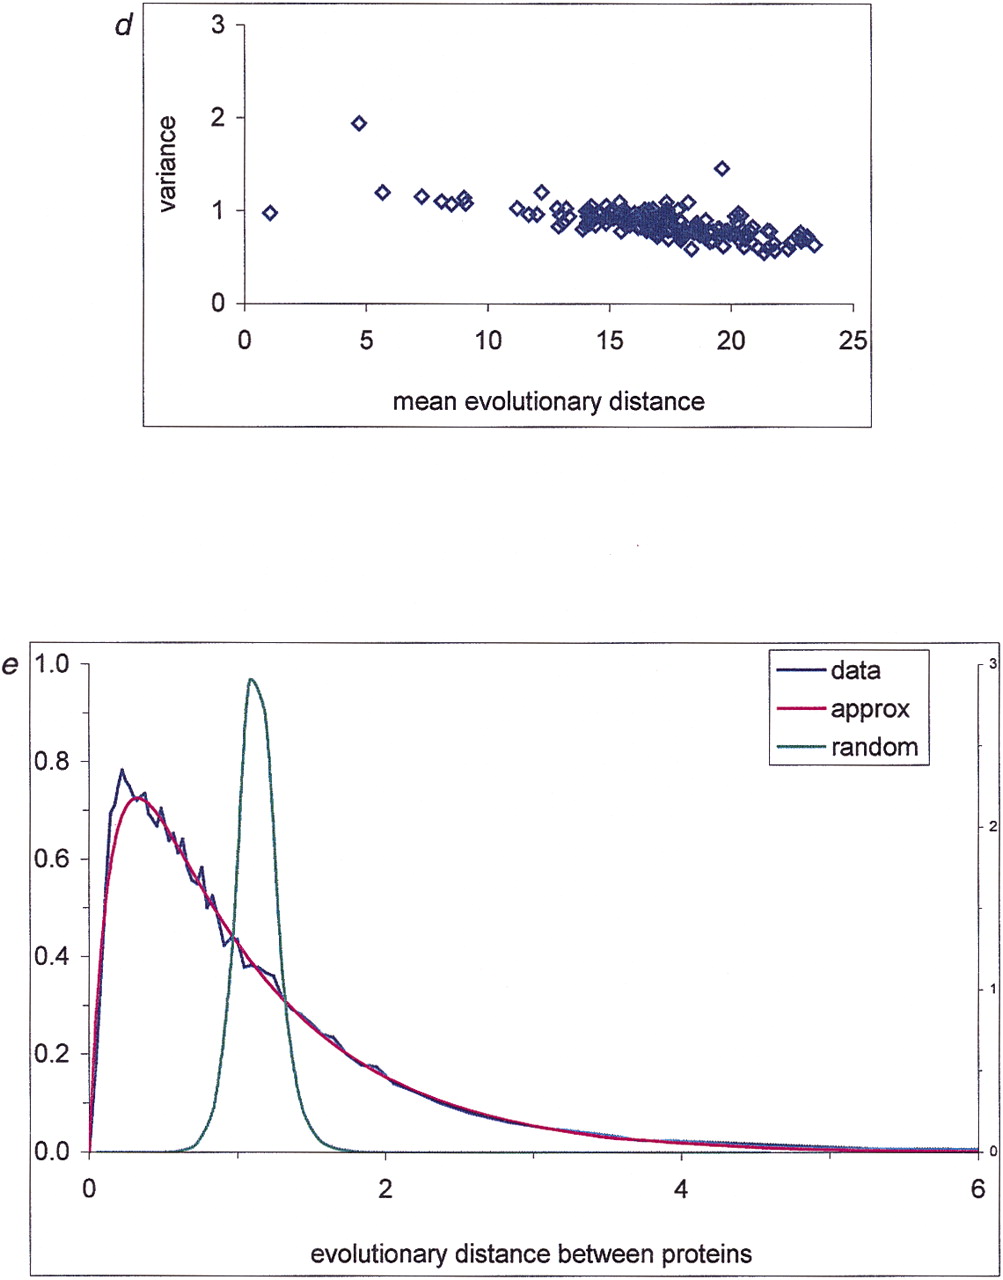
Interprotein rate variation. An empirical distribution function is shown for the fraction of unchanged sites (a), evolutionary distances (b), and normalized evolutionary distances (c) between likely orthologs for several genome pairs. For genome designations, see Methods. (d) Correlation between the variance of the distribution of normalized evolutionary distances and the mean distance between proteins in genome pairs. (e) Probability density function of interprotein substitution rate. The empirical density function of interprotein substitution rate estimated from distances obtained from genome comparisons (data), from approximation (approx) using formula (3), and from random sampling of the intraprotein rate distribution (random) are shown.


