
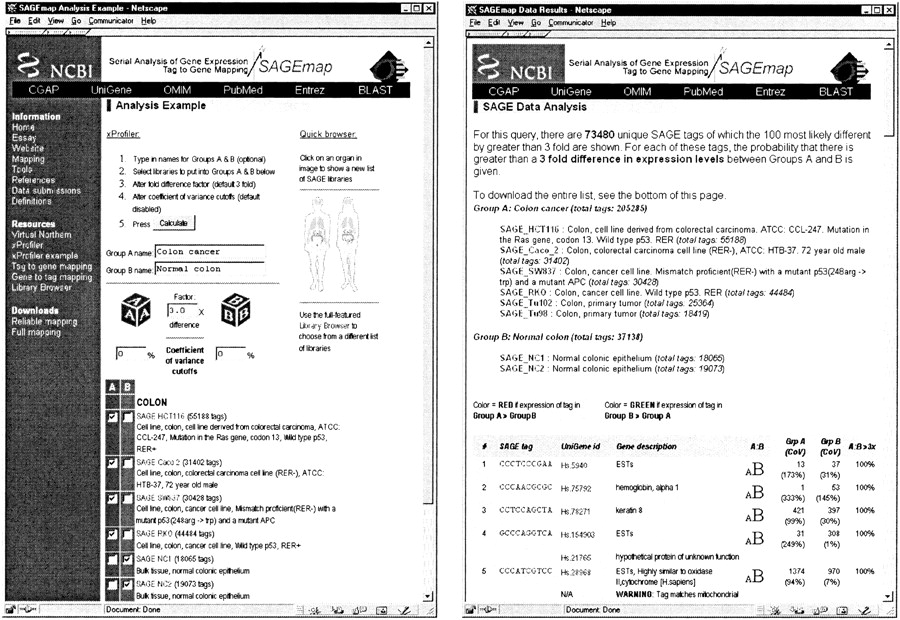
This is an example comparison of colon carcinoma libraries and normal colon libraries. (Left) Names can be chosen for groups A and B, if desired, and the factor parameter upon which the comparison statistic is based; the coefficient of variance cutoffs are set (see text); libraries which are to be put into groups A and B are selected, and the “Calculate” button is pressed. Results are returned in a new window (right), which gives a synopsis of the comparison at the top, lists the names and descriptions of libraries in groups A and B, and results of the statistical comparison (with tag gene assignments) appearing in the lower part of the browser window (see text). In addition, the results of the comparison may be downloaded to a local computer for further analysis.


