
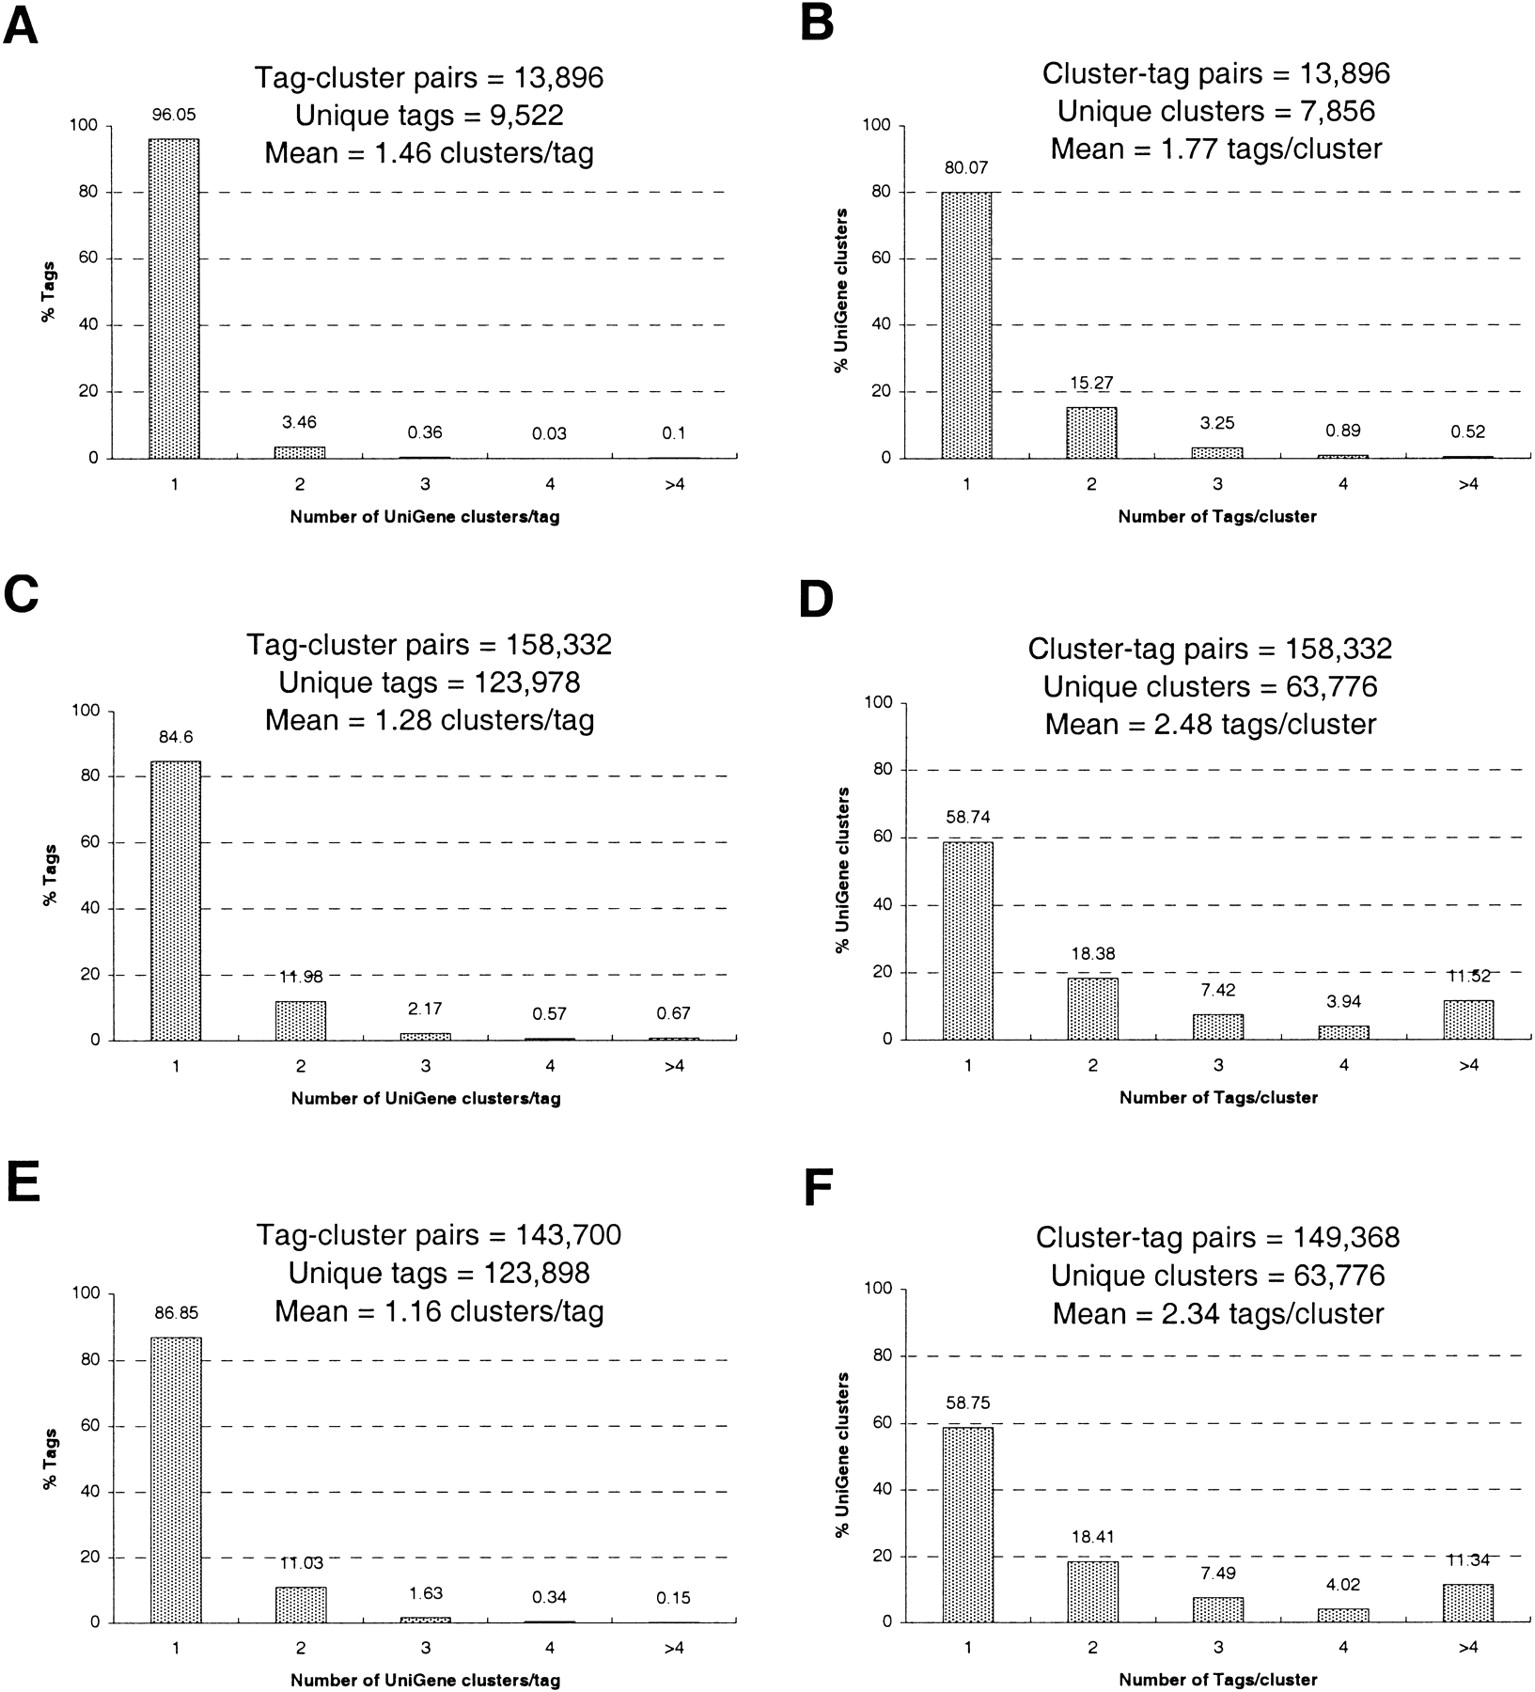
Figure 2.
(A,B) The percent distributions of the tag-to-gene and gene-to-tag mappings, respectively, from October 1999, for well-characterized mRNA/cDNA sequences only (i.e., no EST sequences). (C,D) The distributions for the “full” mappings (including data from tags paired to UniGene clusters). (E,F) The distributions for the “reliable” mappings (see text).


