
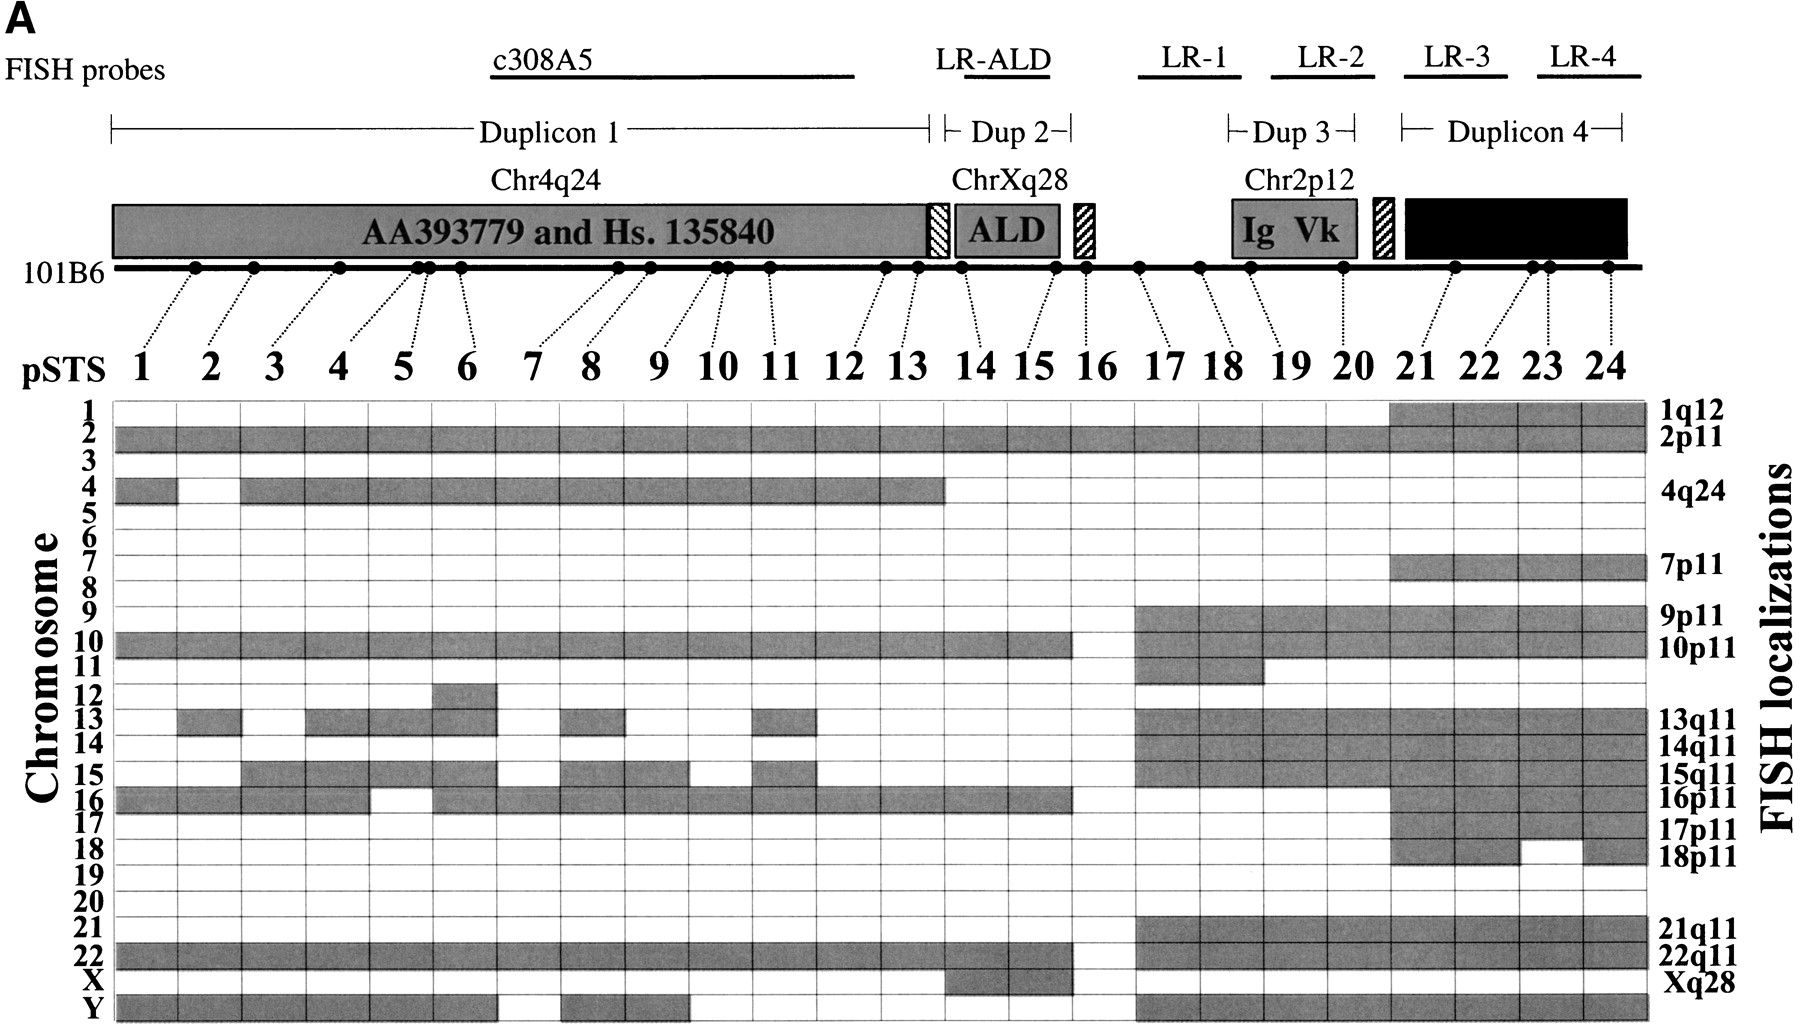
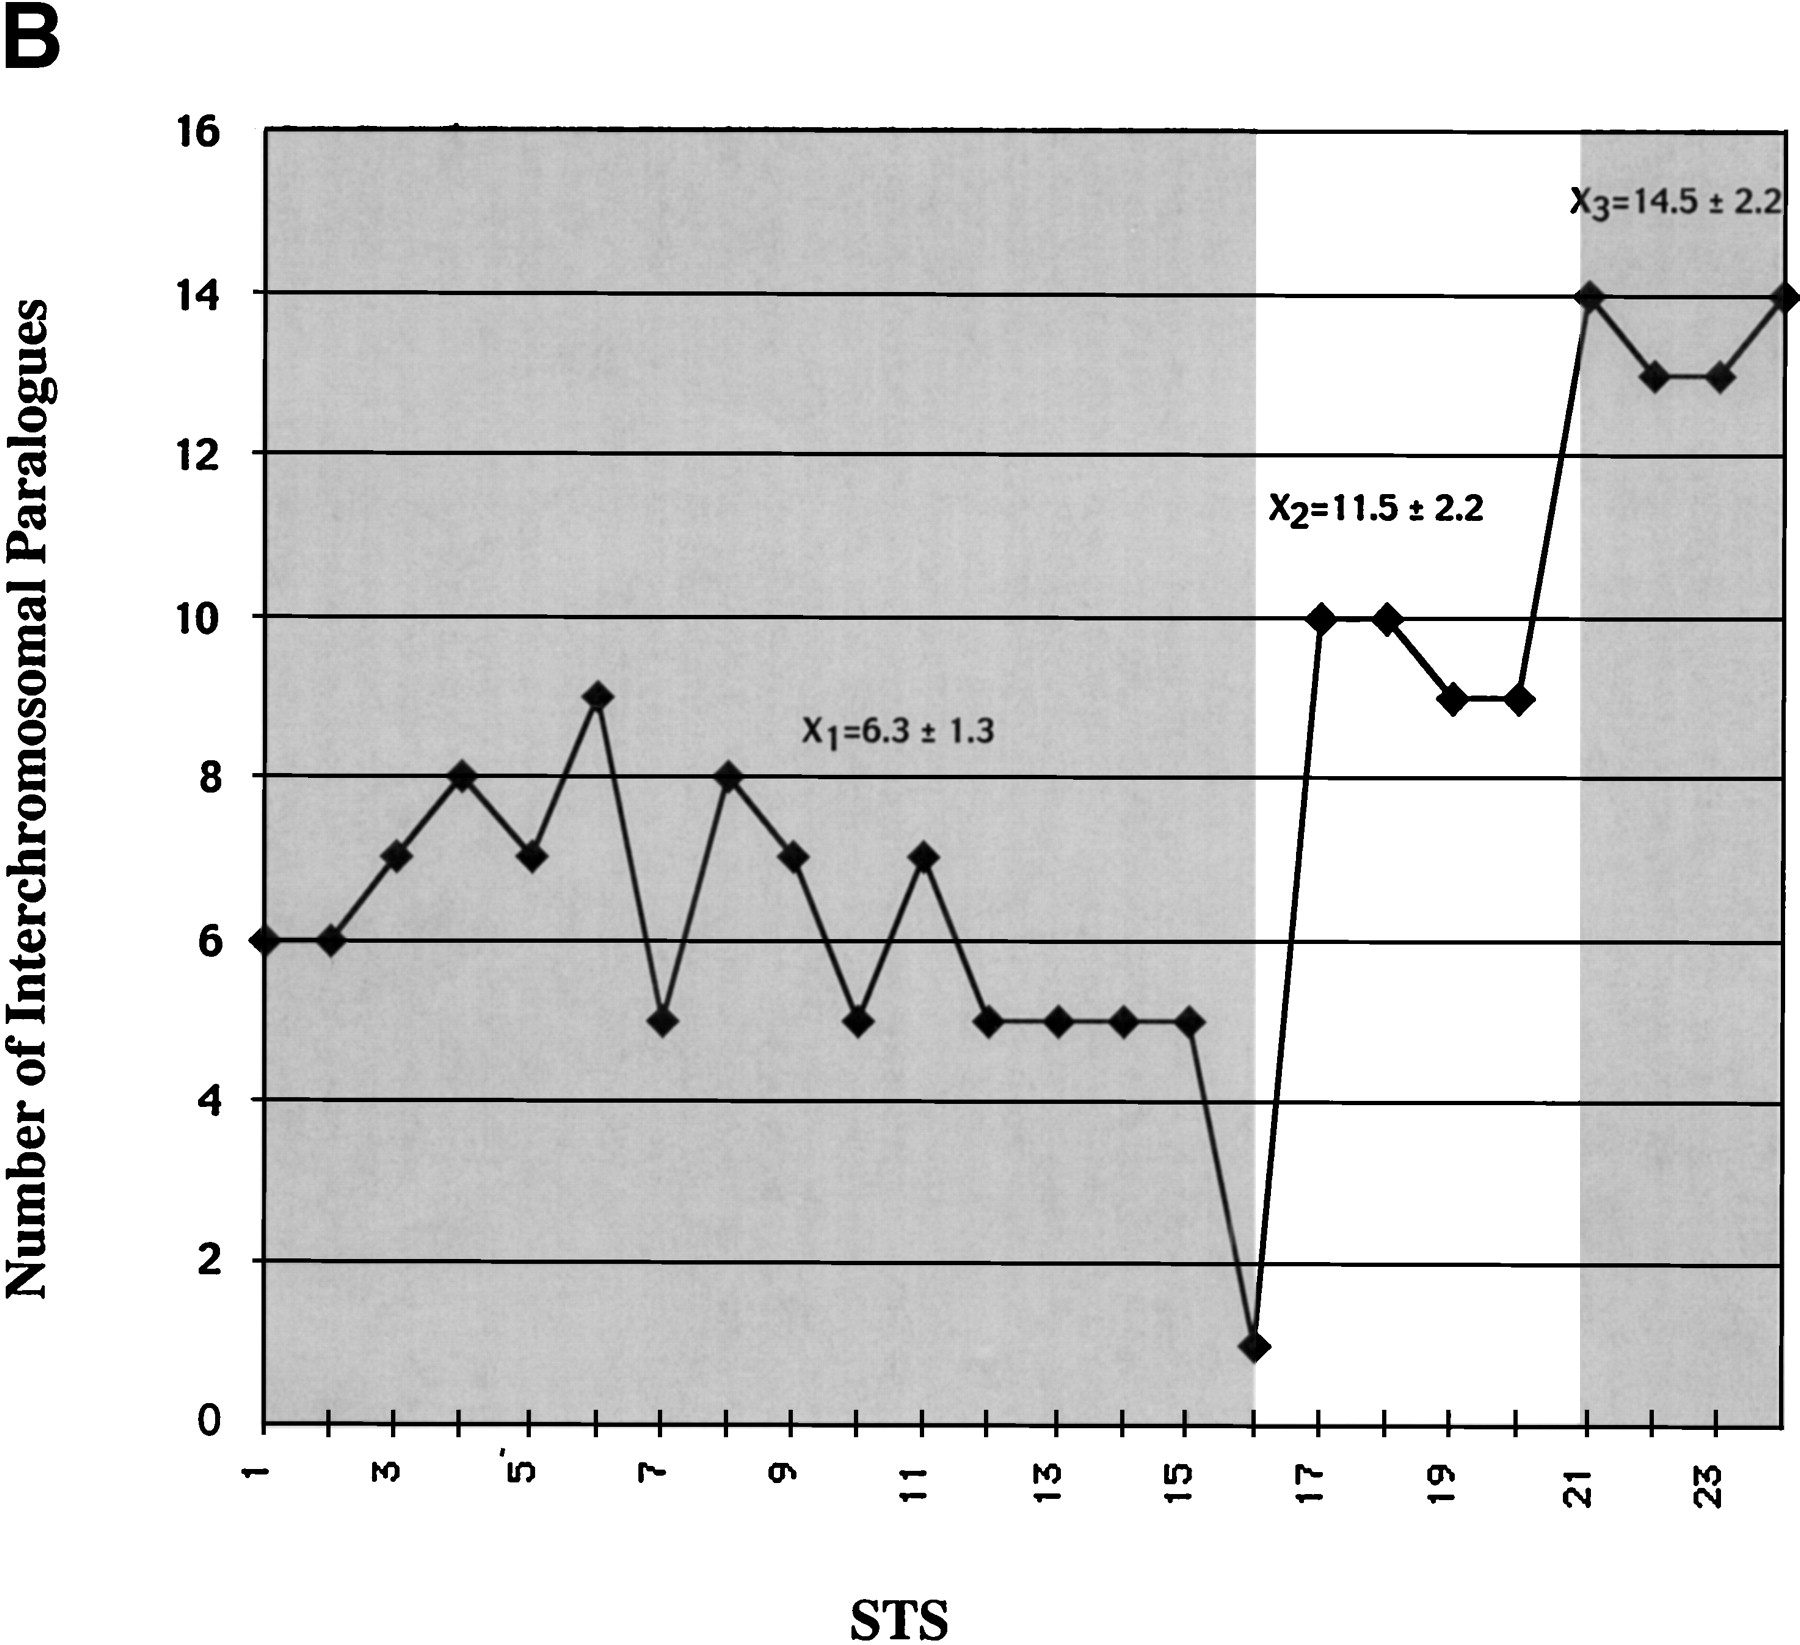
Paralogy map. (a) Summary of PCR and FISH analysis of 101B6. Each column describes the PCR results of one primer pair tested against a panel of 24 monochromosomal somatic cell hybrid DNAs. A total of 24 paralogous STS (pSTS 1–24) primer pairs were developed based on the 101B6 reference sequence. Dots along the top line indicate the approximate position of each primer pair in 101B6 (see Table 3 for the exact location of each primer). The filled gray boxes indicate chromosomal hybrids tested positive by PCR and, therefore, represent the extent of paralogy of each chromosome with respect to the 2p11 reference sequence. As expected, only chromosome 2 tested positive for all pSTS. A schematic of the duplication organization (see Fig.3) of the 2p11 sequence is provided. The positions of long-range PCR (LR-ALD, LR-1 to 4) and the cosmid (c308a5) probes used in FISH assays are indicated. FISH localizations are summarized on the right sideof the figure. These confirm the interchromosomal distribution and cytogenetic position of each pSTS. (b) The number of observed interchromosomal duplications is plotted (y axis) against the position of each paralogous STS. The mean number of duplications is calculated for three groups (X 1=duplicon 1 and 2,X 2=duplicon 3, and X 3=duplicon 4). A significant difference is observed for each pairwise comparison of the means (P < 0.001; two-tailed test; unequal variances).


