
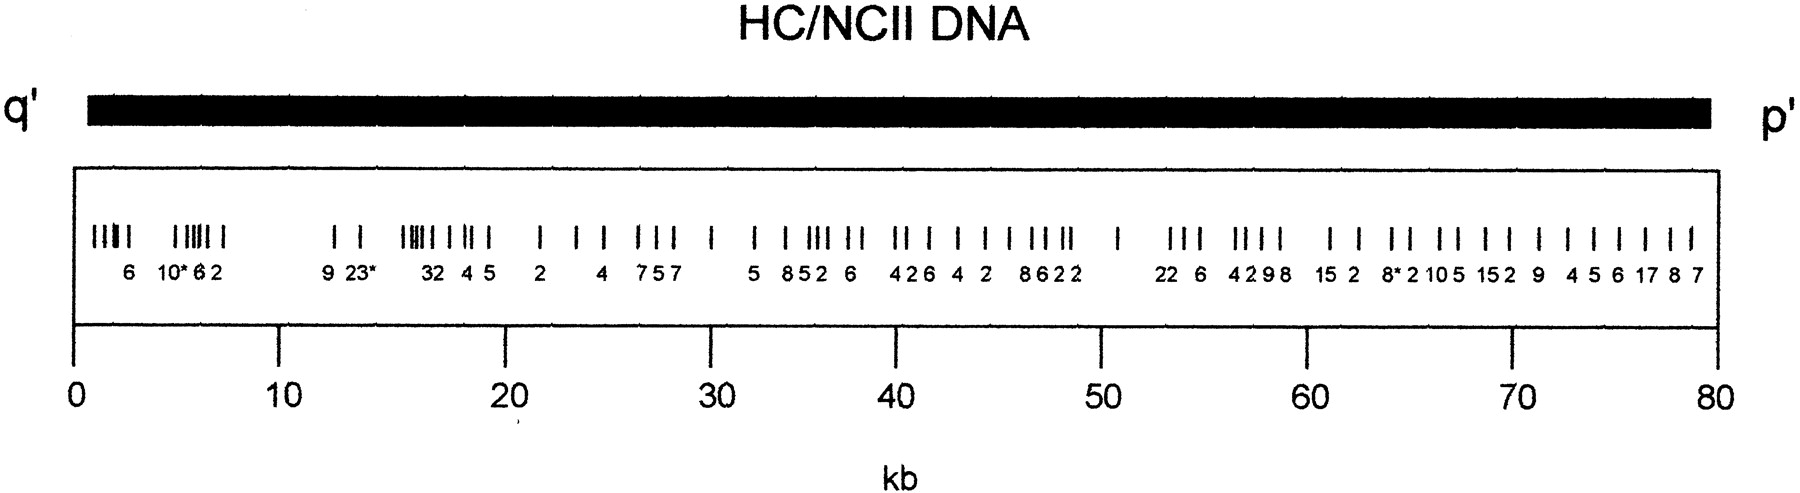
Figure 1.
Differences between the ∼80-kb HC and NCII sequences. Vertical bars represent the positions of single nucleotide differences between the two sequences. The numbers below represent the number of single nucleotide differences (where there is more than one difference) over a 1-kb region. Numbers with asterisks represent clusters of differences.


